
Recommendation
Genetic markers are used for in modern population genetics/genomics to uncover the past neutral and selective history of population and species. Besides Single Nucleotide Polymorphisms (SNPs) obtained from whole genome data, microsatellites (or Short Tandem Repeats, SSR) have been common markers of choice in numerous population genetics studies of non-model species with large sample sizes [1]. Microsatellites can be used to uncover and draw inference of the past population demography (e.g. expansion, decline, bottlenecks…), population split, population structure and gene flow, but also life history traits and modes of reproduction (e.g. [2,3]). These markers are widely used in conservation genetics [4] or to study parasites or disease vectors [5]. Microsatellites do show higher mutation rate than SNPs increasing, on the one hand, the statistical power to infer recent events (for example crop domestication, [2,3]), while, on the other hand, decreasing their statistical power over longer time scales due to homoplasy [6].
To perform such analyses, however, an excellent and reliable quality of data is required. As emphasized in the article by De Meeûs et al. [7] three main issues do bias the observed heterozygosity at microsatellites: null alleles, short allele dominance (SAD) and stuttering. These originates from poor PCR amplification. As a result, an excess of homozygosity is observed at the microsatellite loci leading to overestimation of the variation statistics FIS and FST as well as increased linage disequilibrium (LD). For null alleles, several methods and software do help to reduce the bias, and in the present study, De Meeûs et al. [7] propose a way to tackle issues with SAD and stuttering.
The authors study a dataset consisting of 387 samples from 61 subsamples genotyped at nine loci of the species Ixodes scapularis, i.e. ticks transmitting the Lyme disease. Based on correlation methods and FST, FIS they can uncover null alleles and SAD. Stuttering is detected by evaluating the heterozygote deficit between alleles displaying a single repeat difference. Without correction, six loci are affected by one of these amplification problems generating a large deficit of heterozygotes (measured by significant FIS and FST) remaining so after correction for the false discovery rate (FDR). These results would be classically interpreted as a strong Wahlund effect and/or selection at several loci.
After correcting for null alleles, the authors apply two novel corrections: 1) a re-examination of the chromatograms reveals previously disregarded larger alleles thus decreasing SAD, and 2) pooling alleles close in size decreasing stuttering. The corrected dataset shows then a significant excess of heterozygotes as could be expected in a dioecious species with strong population structure. The FDR correction removes then the significant excess of homozygotes and LD between pairs of loci. FST on the cured dataset is used to demonstrate the strong population structure and small effective subpopulation sizes. This is confirmed by a clustering analysis using discriminant analysis of principal components (DAPC).
While based on a specific dataset of ticks from different populations sampled across the USA, the generality of the authors’ approach is presented in Figure 6 in which they provide a step by step flowchart to cure microsatellite datasets from null alleles, SAD and stuttering. Several criteria based on FIS, FST and LD between loci are used as decision keys in the flowchart. An excel file is also provided as help for the curation steps. This study and the proposed methodology are thus extremely useful for all population geneticists working on non-model species with large number of samples genotyped at microsatellite markers. The method not only allows more accurate estimates of heterozygosity but also prevents the thinning of datasets due to the removal of problematic loci. As a follow-up and extension of this work, an exhaustive simulation study could investigate the influence of these data quality issues on past demographic and population structure inference under a wide range of scenarios. This would allow to quantify the current biases in the literature and the robustness of the methodology devised by De Meeûs et al. [7].
References
[1] Jarne, P., and Lagoda, P. J. (1996). Microsatellites, from molecules to populations and back. Trends in ecology & evolution, 11(10), 424-429. doi: 10.1016/0169-5347(96)10049-5
[2] Cornille, A., Giraud, T., Bellard, C., Tellier, A., Le Cam, B., Smulders, M. J. M., Kleinschmit, J., Roldan-Ruiz, I. and Gladieux, P. (2013). Postglacial recolonization history of the E uropean crabapple (Malus sylvestris M ill.), a wild contributor to the domesticated apple. Molecular Ecology, 22(8), 2249-2263. doi: 10.1111/mec.12231
[3] Parat, F., Schwertfirm, G., Rudolph, U., Miedaner, T., Korzun, V., Bauer, E., Schön C.-C. and Tellier, A. (2016). Geography and end use drive the diversification of worldwide winter rye populations. Molecular ecology, 25(2), 500-514. doi: 10.1111/mec.13495
[4] Broquet, T., Ménard, N., & Petit, E. (2007). Noninvasive population genetics: a review of sample source, diet, fragment length and microsatellite motif effects on amplification success and genotyping error rates. Conservation Genetics, 8(1), 249-260. doi: 10.1007/s10592-006-9146-5
[5] Koffi, M., De Meeûs, T., Séré, M., Bucheton, B., Simo, G., Njiokou, F., Salim, B., Kaboré, J., MacLeod, A., Camara, M., Solano, P., Belem, A. M. G. and Jamonneau, V. (2015). Population genetics and reproductive strategies of African trypanosomes: revisiting available published data. PLoS neglected tropical diseases, 9(10), e0003985. doi: 10.1371/journal.pntd.0003985
[6] Estoup, A., Jarne, P., & Cornuet, J. M. (2002). Homoplasy and mutation model at microsatellite loci and their consequences for population genetics analysis. Molecular ecology, 11(9), 1591-1604. doi: 10.1046/j.1365-294X.2002.01576.x
[7] De Meeûs, T., Chan, C. T., Ludwig, J. M., Tsao, J. I., Patel, J., Bhagatwala, J., and Beati, L. (2019). Deceptive combined effects of short allele dominance and stuttering: an example with Ixodes scapularis, the main vector of Lyme disease in the USA. bioRxiv, 622373, ver. 4 peer-reviewed and recommended by Peer Community In Evolutionary Biology. doi: 10.1101/622373
DOI or URL of the preprint: http://dx.doi.org/10.1101/622373
Version of the preprint: 3
Dear Editor,
Please accept the revised version or our manuscript, entitled "Deceptive combined effects of short allele dominance and stuttering: an example with Ixodes scapularis, the main vector of Lyme disease in the U.S.A.," for resubmission to Peers Community In Evolutionary Biology.
Following Recommender and Editorial Board requests detailed in your last email, we have added a small paragraph at the end of the manuscript discussing issues about Bayesian clustering and added one figure (Figure 7). We have also formatted the manuscript following the template recommended for PCI Evol Biol.
We hope you will now find this article suitable for recommendation in Peers Community In Evolutionary Biology and we remain at your disposal for any more modifications or questions you may have.
Please note that the raw and cured datasets are available as “supplementary file S1” on my web site at: http://www.t-de-meeus.fr/Data/DeMeeus-et-al-SAD&StutteringI-scapularisUSA-PCI-EvolBiol-TableS1.xlsx
Sincerely,
 , posted 03 Sep 2019
Dear Thierry (and co-authors),
I thank you for answering all comments by the reviewers. Many thanks also for clarifying your position regarding issues of using other software, which has been most helpful to me.
Can I ask you to add some of the info your gave as a reply to reviewer 2 and myself (as 2-3 sentences in the manuscript)?
Providing this last minor revision, I would accept and write a recommendation of the preprint.
I copy below some parts of your reply which could be added in the manuscript to justify the difference of your aim/results to using Structure or other software. I would personally add the DAPC figure you suggested in your reply to me, but I leave it up to you if you wish to do so.
“By contrast to the aim of this study, clustering techniques are useful to detect a Wahlund effect. Structure (and other software) can be very helpful to estimate the race or species assignment of different individuals of a population, but this was not the aim of the study. The fact that we obtain, with the cured data set, substantially negative FIS and substantially high FST estimates obviously argues in favour of a strong population subdivision. The estimates of Nm in an Island model (here Nm=1 and N e =7) illustrate this point and support the idea that this tick population is strongly subdivided. This results is corroborated by a DAPC graphic (see Additional Figure XX), based on cured data, which provides quite a strong structure (mean assignment is 0.96), but, even if some geographic concordance can be noticed (Cluster8 is mainly Wisconsin), many individuals that belong to the same cluster originated from remote sites.”
I look forward to accept the article and to write a recommendation,
Sincerely
Aurelien Tellier
Additional requirements by the Managing board:
In order to reach a better referencing and greater visibility of your recommended preprint, we suggest you to do the following modifications :
(i) add the following sentence in the acknowledgements: "This preprint has been peer-reviewed and recommended by Peer Community In Evolutionary Biology (https://doi.org/10.24072/pci.evolbiol.100081) »
Note that this DOI is not the DOI of your article, but the DOI of the recommendation text that Aurelien Tellier will write. The DOI of your article remains unchanged.
Doing so is very important because it would:
-indicate to readers that, unlike many other preprint in this server, your pre-print has been peer-reviewed and recommended
-make visible this information in Google Scholar search (which is quite important).
(ii) In addition, we suggest you to remove line numbering from the preprint.
Optional modifications
If you wish, we advise you to use templates (word docx template and a latex template) to format your preprint in a PCI style. This is optional. Here is the links of the templates: https://peercommunityin.org/templates/
Please be careful to correctly update all text in these templates (doi, authors’ names, address, title, date, recommender first name and family name …). Please be careful to also choose the badge “Open Code” if appropriate (in addition to the “Open access”, “Open data” and “Open Peer-Review” badges).
Indicate in the “cite as” box the version of the article that you are currently formatting. This should be version 4.
If some of the reviewers are anonymous, indicate for example “Albert Ayler and two anonymous reviewers”.
If you have any question, please do not hesitate to contact us: contact@evolbiol.peercommunityin.org
DOI or URL of the preprint: 10.1101/622373
Version of the preprint: 2
, posted 12 Aug 2019Dear authors,
You have addressed satisfactorily most points from the first two reviewers, and I am pleased to say that the paper has gained in clarity. The Figure 6 has proven to be very effective in summarizing the steps of data curation. However, as you want to stay with the format of a short communication, the study still reads quite narrow in focus and appears as a specific problem arising from this particular dataset.
The lack of generality of the study is highlighted by the new reviewer 2. This reviewer has suggestions which would require work beyond the scope of a short communication namely 1) to conduct in depth study of spatial structure/past demographic history (emphasize the biological results), or 2) perform a simulation study (emphasize the methodological results). As you have rebuked my suggestion to perform such additional work after the first round of review, I will not insist.
I nevertheless recommend to add one paragraph and one figure of population structure analysis with one of the classically used software as suggested by the new reviewer 2. These new results and the comparison to the Fst/Fis computed values can thus be discussed and provide additional evidence for the strong population structure in this species. This would reinforce and clarify the biological conclusion of the paper. Such addition would be also valuable to enlarge the conclusion of the paper, for example as a warning/word of caution on the influence of data curation on results obtained by classic methods (structure,...). To avoid the multiplication of figures, a possibility for a short communication article could be to group Figure 2, 3 and 5 in a single multiple panel figure.
Providing this additional result part and adequate reply/changes to the last minor comments by both reviewers, I believe that the article should qualify for acceptance in PCI Evol Biol in the very near future.
Best regards, and looking forward to the hopefully last version of the manuscript.
Aurelien Tellier
Additional requirements of the managing board:
As indicated in the 'How does it work?’ section and in the code of conduct, please make sure that:
-Data are available to readers, either in the text or through an open data repository such as Zenodo (free), Dryad (to pay) or some other institutional repository. Data must be reusable, thus metadata or accompanying text must carefully describe the data.
-Details on quantitative analyses (e.g., data treatment and statistical scripts in R, bioinformatic pipeline scripts, etc.) and details concerning simulations (scripts, codes) are available to readers in the text, as appendices, or through an open data repository, such as Zenodo, Dryad or some other institutional repository. The scripts or codes must be carefully described so that they can be reused.
-Details on experimental procedures are available to readers in the text or as appendices.
-Authors have no financial conflict of interest relating to the article. The article must contain a "Conflict of interest disclosure" paragraph before the reference section containing this sentence: "The authors of this preprint declare that they have no financial conflict of interest with the content of this article." If appropriate, this disclosure may be completed by a sentence indicating that some of the authors are PCI recommenders: “XXX is one of the PCI XXX recommenders.”
Dear colleagues,
I have reviewed this paper before and find that the authors in their revisions have addressed most points satisfactory. I still think that the sample size for the subpopulations is rather on the low site, but the authors have ample experience and hence I believe their judgement. One thing I found a bit strange is that the authors consider the change from 22% of loci in LD (prohibitive) to 19% (reasonable) such a large difference. It seems rather minor, but certainly there is an improvement. At The last part of the methods still occur to me like a discussion (Lines 281-301). It is not clear to me which of these named potential remedies the authors performed.
There is a small mistake I Line 265 with a duplication of the author names.
In Line 278, the “instances” where the BH correction was applied should be named and explained.
In Lines 248f the authors propose the presence of selection. It would be nice to know which minor evidence they found.
In figure 4, the authors should name the size of the micropeak in the header to make clearer what is meant.
Besides I congratulate the authors to a nice and valuable contribution.
Kind regards
Martin
De Meeûs et al. investigated the effects of common biases associated with SSR datasets, i.e. null allele, short allele dominance and stuttering, and proposed recommended steps for analyzing biased SSR dataset in general. The authors investigate this question on a total of 387 (? right) tick individuals sampled across the US and genotyped for nine SSR markers. I found the manuscript well written and the questions interesting but I still agree with the previous reviews. Indeed either the authors choose to:
-make a tick-centered analysis, i.e. analyze the dataset to infer population structure, diversity, demographic history, taking into account some biases associated with their SSR dataset, and if they wish, also explaining their framework to prune and analyze it;
-or either the authors choose to perform a methodological paper devoted to the analysis of 1) pseudo-observed data simulated under different assumptions (e.g. as suggested, testing different sampling size, but may be also reproductive systems, different number of biased and unbiased markers, different extent of null alleles, short allele dominance and stuttering…), and 2) of their dataset as done here, and if possible of previously published data sets, to draw general conclusions on how to handle the biases and, if possible, providing new toolkits.
Therefore, at that stage the paper either lacks a theoretical analysis of pseudo-observed unbiased and biased SSR datasets to draw general conclusions, or do not provide deep population genetic analyses to understand the specific evolutionary history of the tick species/populations in the US.
If the theoretical analyses cannot be performed, population genetic structure analyses, and even demographic history of the species, should be provided to get a comprehensive view of the evolutionary history of the disease vector.
Major comments:
1) The authors repeat several times in the manuscript that their data suggest strong population subdivision. However, they do not provide analyses of population structure (e.g. with STRUCTURE and/or TESS softwares, DAPC analyses) with their biased and unbiased datasets. Such analyses should be added. Even inferences of the demographic history may be interesting to explore.
2) The authors pooled alleles close in size to correct for stuttering. They chose their filtering threshold based on the assumptions that in small dioecious species population you expect heterozygous excess, so an extra care was performed to not remove rare alleles. Again, this assumption is a tick-centered, or a dioecious-centered, hypothesis. If the authors would like to provide a framework for a large audience, they should provide wider assumptions, for different model systems for instance, and if possible, using already existing tools. For instance, in the same way the authors cite the FREENA software, there is the AUTOBIN macro (https://www6.bordeaux-aquitaine.inra.fr/biogeco_eng/Scientific-Production/Computer-software/Autobin). Perhaps the authors could use Autobin with different threshold to pool alleles and to provide a guideline for different model systems to correct for stuttering? This is just an idea, but at the moment I still found this pooling methodology a black box and very hard to apply in a general manner.
Minor comments:
-I am still confused with the number of samples, I think the author should summarize in Table 1 the total number of individuals per site (AL1, AL2, …), for instance by adding a line “TOTAL” for each site, and also adding a line TOTAL at the end of the table for the full dataset.
-Figure 6: the authors should add the associated population genetic software to use for each step.
-line 467, when the authors say that their “cures provided satisfactory results”. I am not fully convinced of that point as stated above. At the moment I am a bit frustrated with the results: I indeed miss either a “simulation” or an “evolutionary history” study. The authors should thus make a choice. And thus, I am also not convince about the following statements line 461 “this issue would require a full simulations study” and, line 480 “the correlation between mitochondrial clade and genetic structure is not the scope”.
https://doi.org/10.24072/pci.evolbiol.100202.rev22DOI or URL of the preprint: 10.1101/622373
, posted 11 Jun 2019Dear authors,
Both reviewers and myself do find the topic of the study and the results to be of interest and relevant. Citing reviewer 1, the quest for interpreting difficult microsatellite data indeed deserves attention. It is thus of special interest to understand the biases which can be introduced during the curation steps of these datasets. If the aims, methods and interpretations are clear, the study would benefit from two major improvements. These would enhance the generality of the paper and its relevance for the wider community.
First, both reviewers point out the lack of theoretical “a priori” expectations in the paper. In comments 1-3, reviewer 1 asks to describe the rationale behind the idea that experimental artifacts should increase LD. Reviewer 2 would like to understand in a more quantitative manner the rationale behind pooling alleles close in size and the effect of the sample size on the results. The latter is important as in the study the authors chose a small sample size, while microsatellites have bene recently applied to much larger datasets (at least on many fungal pathogen species for example). A more thorough comparison with other existing curing methods could be provided. I would suggest as a possible solution to indeed build simulated datasets and apply curing methods revealing the different experimental artifacts. It would thus be possible to reveal general rules and outcomes of applying different curing approaches (including yours), such as changes of basic statistics and LD estimates. The effect of the sample size could also be tested on the same pseudo-observed data by subsampling. This general “theoretical” set-up would allow an in depth discussion of the mechanisms involved and make the article more general in scope. The biological dataset of the tick Ixodes scapularis analyzed here would then be used as an application of these general principles.
If it is not possible to perform such theoretical analysis of the curing of pseudo-observed datasets, several in depth descriptions answering comments of both reviewers should be added to the manuscript.
Second, as reviewer 1 points out (comment 4), most researchers move to other type of markers (GBS, RADseq,…) and it would be helpful to discuss if the effect of curing datasets also apply to those data. As a matter of curiosity, a focus could be on highlighting how population genetics inference combining different types of markers (SSRs, GBS, RADseq) can be affected by curing some markers but not others?
Several minor points are also suggested by the reviewers and need to be addressed for the revision. These include restructuring/reorganizing some parts and providing a flowchart (a schematic description) of the analysis/curing steps (reviewer 2).
I look forward to receive your revised version, and believe that this improved contribution would fit into the scope of PCI Evol Biol and be of general interest to the community.
Best regards.
, 08 Jun 2019Dear Thierry and colleagues,
Your study is an attempt to get the best interpretation out of difficult microsatellite data, a quest that deserves attention. In general, the paper’s aims, methods and interpretations are fair and clear. You use a whole set of diagnostic statistics to disentangle experimental (null alleles, SAD, stuttering) from sampling (Whalund) effects that may explain deviations from expected intra- and inter-locus allelic associations, and you actually end up with an FIS value that is close to what you expect given the biology of your biological model (you however do not discuss that such a value would correspond to Ne~8.7). The cured data set still shows odd behaviors that can be linked to both null alleles and Wahlund effects. The main weakness of the paper is that you do not provide any expectation for the effect of experimental errors on LD. I detail this and other comments below.
Additional comments
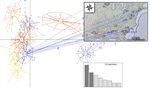
6. AL2 and VA2 are missing from Fig. 1
7. Lines 228-229: There are 25 subsamples with 5 ticks or more, and 23 subsamples with 6 ticks or more
8. Line 361: odd format for the confidence interval
Eric Petit
https://doi.org/10.24072/pci.evolbiol.100202.rev12