
Recommendation
Roses, a symbol of love and beauty, have a rich history of cultivation that spans millennia. While their aesthetic appeal has remained a constant, the genetic changes underlying their domestication and breeding remain intriguing. The manuscript titled "Dark side of the honeymoon: reconstructing the Asian x European rose breeding history through the lens of genomics" by Leroy et al. provides an unprecedented insight into the genomic shifts that accompanied the breeding history of roses in Europe during the 19th century. By leveraging on genotyping and whole-genome sequencing data from more than 200 accessions, this study reconstructs the genetic journey of roses from their European origins to their integration with Asian varieties.
This work is particularly fascinating for evolutionary biologists, geneticists, and horticulturists alike, as it sheds light on several critical aspects of plant breeding history. The study provides compelling evidence of a rapid transition from predominantly European to a near-Asian genetic background within a few generations. This shift highlights the strong influence of Asian roses in shaping modern cultivated varieties, particularly through the introduction of recurrent blooming traits, novel colors, and scents.
A striking finding is the reduction in genetic diversity that occurred during this transition, likely due to selective breeding practices that prioritized a narrow set of desirable traits. This discovery underscores the potential risks of genetic bottlenecks in cultivated plants and raises concerns about the long-term sustainability of modern rose breeding programs.
The study also features a robust methodological framework applied to a unique data set which includes 204 rose accessions, covering both botanically and historically significant varieties. Whole genome sequencing of 32 accessions provides high-resolution insights into genomic evolution. Comprehensive phenotypic characterization over multiple years further allows in-depth investigation of the genetic architecture of key horticultural traits such as petal number, flowering time, disease resistance, and scent composition, with the building of the largest GWAS catalog for roses to date.
Finally, the findings emphasize the need for sustainable breeding practices that balance genetic innovation with the preservation of historical diversity, by maintaining rose collections. Integrating ancient genetic resources into modern breeding programs could enhance resilience against diseases and environmental changes, while maintaining the aesthetic qualities that make roses so beloved.
Overall, the manuscript by Leroy et al. is a landmark contribution to our understanding of the genomic history of rose breeding. By merging historical records with cutting-edge genomic analysis, the study not only reconstructs a critical phase of horticultural evolution but also provides invaluable insights for future breeding strategies.
References
Thibault Leroy, Elise Albert, Tatiana Thouroude, Sylvie Baudino, Jean-Claude Caissard, Annie Chastellier, Jerome Chameau, Julien Jeauffre, Therese Loubert, Saretta Nindya Paramita, Alix Pernet, Vanessa Soufflet-Freslon, Cristiana Oghina-Pavie, Fabrice Foucher, Laurence Hibrand-Saint Oyant, Jeremy Clotault (2024) Dark side of the honeymoon: reconstructing the Asian x European rose breeding history through the lens of genomics. bioRxiv, ver.4 peer-reviewed and recommended by PCI Evol Biol https://doi.org/10.1101/2023.06.22.546162
 , 24 Jan 2025
I sincerely apologize to the authors for the additional time required to complete this review. I would also like to thank them for the considerable effort and thought they put into addressing my comments as well as, in my opinion, those raised by the recommender and other reviewers.
The new Supplementary Note 2 is a valuable and convincing addition regarding the ploidy matter. For future developments, and since authors mention the production of novel WGS data, I suggest exploring k-mer-based approaches such as GenomeScope/Smudgeplot (https://github.com/KamilSJaron/smudgeplot) to further clarify ploidy levels.
Upon reviewing the authors' response, I have realized that my initial remark on RoD may have been unclear — apologies. I did not intend to question the relevance of the analysis, but rather I did not fully understand the methodological choices made. The authors' response has alleviated my concerns, and as a non-specialist in the field, I find the revisions to the main text helpful in clarifying the knowns and unknowns of rose domestication history!
Finally, I commend the authors for their transparency and dedication in making all relevant materials, code, data, and results available, including the novel QQ plots.
I look forward to seeing this work published and wish to express my sincere condolences to the authors and all those affected by the recent and unexpected passing of their colleague.
https://doi.org/10.24072/pci.evolbiol.100793.rev21I thank the authors for addressing the various comments I raised, and I would also like to congratulate them on their work in general. I'm still a bit concerned about the use of certain approaches in samples with variable ploidy, but I acknowledge that the authors have made efforts to take these aspects into account (and have added a supplementary note on this aspect). I'm not convinced that the parameters recommended by the authors of KING guarantee robustness when the software is applied to such a different population. It should work for discarding highly related individuals (their main goal), but for estimating distances in generations between individuals ... But overall I think the manuscript is very interesting with a very nice model.
I just have one other small comment. On lines 311-313 you refer to the Q+K model. You might want to explain what Q and K are. In particular, you should explain how K is estimated in your study (K doesn't seem to be defined). Also, a few lines above you use K to refer to the number of clusters in the faststructure analysis (so you use twice K for very different parameters).
https://doi.org/10.24072/pci.evolbiol.100793.rev22DOI or URL of the preprint: https://doi.org/10.1101/2023.06.22.546162
Version of the preprint: 3
The manuscript by Leroy and collaborators details the evolution of rose breeding in Europe using a newly generated (and impressive) resource consisting of genotyping and whole genome resequencing data from accessions (>200 and 32 for genotyping and WGS data, respectively) representative of varieties cultivated in the 19th century, the period of varietal expansion. The authors illustrate a genetic transformation in modern roses and their ancestors following interbreeding between ancient European and Asian gene pools. They identify specific genomic regions under artificial selection, in particular a significant region harboring a recognized gene associated with repeated flowering. In addition, through extensive SNP array analysis and multi-year phenotyping, the authors compile a comprehensive GWAS dataset encompassing diverse traits such as disease resistance and floral scent components. Overall, I enjoyed reading this manuscript and appreciated the efforts of the authors to carefully address all the issues raised in a first round of review for another journal.
The manuscript was reviewed by three other colleagues, all of whom were positive. Nevertheless, a number of relevant suggestions were made, which in my opinion should help to further improve the manuscript. As an aside, I might also suggest the authors to perform a random allele PCA (see e.g. section 7.1 of the poolfstat R pcakage vignette: https://cran.r-project.org/web/packages/poolfstat/vignettes/vignette.pdf or pca_mds program of the ANGSD package: https://www.popgen.dk/angsd/index.php/PCA_MDS), possibly on all SNPs (i.e. not sure if LD pruning is really needed), in particular to ensure that the assumption of tetraploidy for all individuals (including the coding diploids as tetraploids) does not affect the PCA results presented in Figure 2.
I would be, of course, happy to consider a revised version of the manuscript for possible recommendation.
, 21 Jun 2024In their preprint, Leroy et al. document the history of rose breeding in Europe, showing the impact of recent domestication on both phenotypes of interest and patterns of genetic variation in rose accessions. Authors show in modern roses and their ancestors a shift in the genetic composition after admixture between the two ancient European and Asian gene pools. They also pinpoint candidate genomic regions under artifical selection, including one large region harbouring a known candidate gene associated with recurrent blooming. Finally, combining SNP array data and phenotyping over multiple years, authors provide a large GWAS catalogue for many traits of interest, including disease susceptibility and floral scent components.
Overall, I enjoyed the paper and found it carefully written, concise, and richly illustrated, and I congratulate authors for the impressive amount of work carried. I also appreciated how they rightly addressed some limitations of their GWAS approach in the discussion.
My main criticism is regarding clarity in some places, and I believe it stems partly from the shift between results first in the original version available on biorxiv, and methods first in this second version I reviewed. For instance, some parts of the results read like discussion and might be moved either there, or in the introduction (authors sometimes point to prior assumptions, eg L585 or L682-685, without mentioning them earlier in their manuscript). In the introduction, precisely, the section on rose domestication L103-127 is quite short and could be expanded to provide readers with a state of the art regarding rose domestication. Some of my minor comments below aim at addressing this general (light) issue at specific locations, and I hope they will help authors improving the overall clarity of their manuscript.
Minor comments:
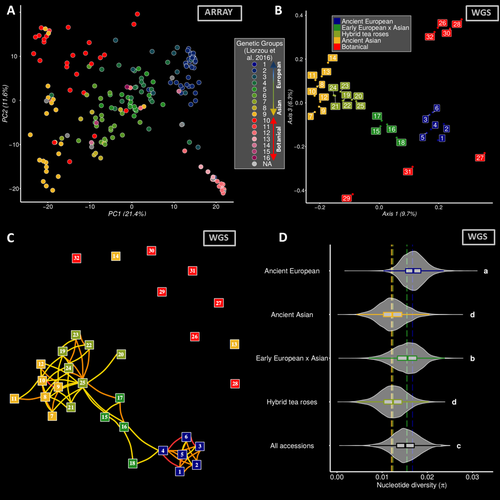
L175-184: Consider giving more details on the sampling in relation with the overall genetic structure depicted in the introduction L103-127. From Fig. 2B it appears sequenced samples span the major lineages, and mentioning it already here would ease understanding later on.
L330: From Fig. S2 (where colors are missing, by the way), it seems several samples peak between 0.1 and 0.2, but such values are not discussed in the main text. Results from Table S2 indicate hexaploidy was not considered for these samples while if I understood correctly the analysis, it would fall within this range (hexaploidy is also indicated for several accessions in the zenodo repository linked L330). Could authors elaborate a bit more on these peaks?
L394: I don’t fully grasp the rationale of the RoD analysis strategy, which may be linked to my misunderstanding of the domestication history. My problem is two-fold:
1/ early European x Asian roses are mentioned for the first time L392, and their relationship to the hybrid tea rose group is unclear at this stage of the manuscript (eg ancient diverged lineage? Proxies for the ancestors to hybrid tea roses?).
2/ I don’t see how the RoD index is informative as it is currently done, since from L103-127 hybrid tea roses result from admixture events between ancient Asian and ancient European, and I would assume such admixture events might have an impact on the range of possible RoD values. For instance, Fig. 2D shows that pi is smaller in ancient Asian compared to ancient European. As these values were also used to detect candidate sweep regions (L427, but see my next comment), this requires further justification (possibly some hints given L631-634 could be moved to the introduction?). Why not using weigthed ancient Asian and ancient European pi averages, as it was done later in the section "Genetic diversity erosion"?
I think both points can be answered by clarifying the rationale behind the RoD analysis carried with these admixed samples, especially as authors actually computed RoD between several lineages (see L690 and Fig. S11). To do so, it could be helpful to provide a tree displaying evolutionary relationships between the different accessions (eg a phylogenetic network based on genetic distances). I think moving L586-593 in the introduction would also help. Finally, on this topic of loss of diversity, an interesting addition might be to compute runs of homozygosity (eg with Plink) to contrast inbreeding regimes between ancient and modern accessions.
L427: In hybrid tea roses, putative sweep regions are identified as being simultaneously outliers in diversity, RoD index and Tajima's D, but this might be circular since diversity is also used to build RoD (and low diversity regions should by definition display high RoD). Does removing diversity (or RoD) from this pipeline significantly change results?
L575-476: As is, I find this result puzzling and while I trust authors' expertise, I would like to know more. Is the explanation that "a large proportion of the diversity is indeed only present in the botanical accessions" (L576) the most parcimonious? Is there any evidence regarding accessions #27 & #29 (outliers in Fig. S8) that would corroborate this hypothesis (eg their origin, or some phenotypic trait values)? Alternatively, was there any issue (eg contamination) with genomic data from these samples? Of note, percentages of variance, sample coordinates in PC space and sample IDs displayed along with mapping rates in Fig. S3 don't match with those of Fig. 2B, making any sanity check impossible. Additionally, consider adding sequencing depth information for each accession in Table S2.
roseGWASbrowser.github.io: This looks like an great resource. To ensure data reuse, providing SNP association metrics for each analysis would be helpful. GitHub storage space may be a limiting factor, however these tables could be stored on another repository (eg zenodo or data.inrae.fr) with links provided on GitHub. Minor point, circular PDF plots are not displayed on Safari (sorry), but it works fine with Chrome and Firefox.
Some small remarks / typos below:
L206: As a naive reader, does petal number vary for a given accession?
L242: Consider defining briefly DQC.
L339: Missing "s" (17,669 SNPs)
L405-408: While this is results material, it would be informative to already give the number of genotypes per group here.
L409: Consider rephrasing: "a reference allele frequency of 0 in one group, and 1 in the other group".
L419: "170,637 diagnostic SNPs with our sampling" may be more correct?
L477-497: Some parts may be moved in the discussion, but I don't have any strong feeling on the matter.
L615: Should it read "containing up to"?
L747: Split "impactfuldiseases".
L749: "varies".
L900: Split "isespecially".
Fig. 1A: Consider justifying in the legend the choice of time intervals on the y-axis. Are they purely illustrative, based on some historical facts, or to split accessions and traits evenly in time?
Data availability section: mention that the raw array data was made available on GitHub, and consider archiving the GitHub repo (eg https://docs.github.com/en/repositories/archiving-a-github-repository/referencing-and-citing-content#issuing-a-persistent-identifier-for-your-repository-with-zenodo).
In their work on the breeding history of roses, the authors have built up a very nice resource that makes it possible to study rose breeding over time. Indeed, a large number of samples have been sequenced and phenotyped for a wide variety of traits. For a non-rose specialist like myself, the study therefore seems original, with a number of different phenotypes (recurrent blowing, scent components). The species is also interesting because it is a domesticated species, but selected for non-agronomic reasons, with a different mode of reproduction and with a more recent history. All this gives originality to the study and makes it pleasant to read.
Despite this nice resource, the description of the GWAS results is quite short and not very informative. The authors claim that this resource can make breeding more effective, but it is not clear how? Similarly, there are few results on selection signatures. The high levels of relatedness and 'low' numbers of individuals might reduce the resolution and power of these analyses?
An original aspect of the study is that there is variable ploidy among the samples. At least some of the analyses take this into account, but I still wonder whether ploidy is correctly taken into account in all analyses (I'm not an expert in variable ploidy data analysis myself). When ploidy is taken into account, the authors simply refer to some tools without clearly explaining how ploidy is taken into account. In some parts, the tools seem clearly adapted for different ploidy levels, but in other analyses it remains less obvious (e.g. population structure, relatedness, signatures of selection).
The title sounds nice, but I did not see a direct link to the results of the paper.
Why is only a subset of SNPs selected in the population structure analysis when you have full sequence data? The number of final SNPs (17,669) seems extremely small compared to the total number of SNPs available.
Is considering individuals with n=2 as n=4 correct for PCA and faststructure?
KING is designed for diploid individuals and not for different ploidy levels. Some assumptions of the method may be violated here. In addition, the rules for declaring individuals as 1st, 2nd, 3rd degree are relatively simple and may differ according to the structure of the population (they were first designed for humans). Therefore, I'm not sure if the KING analysis is completely correct (definition of relatedness for samples with different ploidy levels) and if the classification (in 1st, 2nd degree) is still 100% accurate?
For clones, you use a threshold of 0.354. If the individuals are identical the kinship should be 0.5 (only new mutations would create differences).
Base Quality Score Recalibration. If there is no set of highly reliable SNPs, it is recommended to use this tool iteratively, improving your high quality set at each iteration. Also, what have you done for indels?
For estimating nucleotide diversity, the number of chromosomes per group is standardised. However, I wonder if using one tetraploid versus two diploids is really equivalent for estimating diversity? It might depend on the timing of the 'duplication' event (when were the extra copies acquired?).
On line 401 - 'Diagnostic alleles': perhaps you could start by explaining what these diagnostic alleles are and why you need them. This only became clear later.
GWAS: why did you not fit a traditional genomic relationship matrix to account for population structure?
Rose GWAS browser: some examples I tested were missing the legend in the middle.
https://doi.org/10.24072/pci.evolbiol.100793.rev12, 02 Jul 2024This manuscript aims at characterizing the genetic and genomic changes during rose breeding, focusing on the 19th century. The choice of this particular period is justified by the fact that it corresponds to a strong increase in the number of varieties.
The paper represents a huge work with the release of genotypic data corresponding to more than 50k SNPs on more than 200 varieties and full genome sequences (short reads) on 15 varieties. These full genome sequencing data were combined with publicly available data of 17 varieties for detailed population genomic analyses, including the search for artificial selection footprints. The genotypic data on the entire set of varieties was further combined with phenotypic data on key traits of interest to perform genome-wide association studies, providing a large catalog of associated SNPs.
The manuscript is well-written and easy to read.
The authors should further be complimented for their effort to release the data, scripts, and results. This last point is particularly illustrated by the dedicated website built to release the GWAS results, which is not usual in the plant community.
This manuscript has previously been reviewed by 3 reviewers for a journal. I have read the revised manuscript as well as the reviews and responses made by the authors. Overall I think that the authors have done a good job in responding to the issues raised by the 3 reviewers, which were quite focused on the degree of ploidy of the species.
I am not a specialist in population genomics nor polyploid species, so here I will focus my review on the GWAS part on which I have several comments/suggestions, even if I understood that it was intentionally not presented in a very detailed manner in the manuscript because the scope of the work is broader with the genomic diversity part. I think that focusing GWAS results for a particular trait (resistance to blackspot disease) is fine with all the other results being available on the dedicated website. The choice of the trait is well justified.
Even if this part (GWAS) is quite small in the results section, I think that if it is presented, more details should be provided in the method section regarding the statistical models used to test associations. This is particularly important because the work is on a polyploid species which is not so usual, consequently leading to several ways of modeling the effect of the SNPs. So I would suggest to provide more details on the model used.
Also, I think that some results are lacking, such as qqplots which have been generated according to the method section (or maybe I missed them?). Although there are a lot (number of traits times the number of models), they could inform the fit of the GWAS models, especially regarding the confounding usually attributed to population structure which seems, by the way, a concern for some phenotypes under study. I would recommend providing them as supplementary information.
I must also admit that I dislike the circular Manhattan plots which do not help appreciating if this usual problem has properly been handled by the model. But I also understood from the author's response to previous reviews that it is not possible to generate and make available the classic Manhattan plots for all the models times traits investigated. If they can instead provide the qqplots as a supplementary, I think it would be great. Because I am not a specialist in polyploid species, I am curious about the models’ fit and I would like to check if there could be a particular pattern in the results according to the model (additive vs. dominant...).
Other points:
- Regarding the traits under study, it seems that GWAS have been made for several architectural traits, but I did not find the description of these traits in the material and method section.
- I did not like so much the first paragraph of the discussion (l767-780) which is a bit out of the scope.
Typos
- l672: there are 2 « also » in the same sentence, maybe remove the second one
- l696: « target breeding » -> « breeding target » ?
- l747: a space is missing between « impactful » and « diseases »
- l900: a space is missing between «is» and « especially »
https://doi.org/10.24072/pci.evolbiol.100793.rev13