
Recommendation
Sequencing and analyzing SARS-Cov-2 genomes in nearly real time has the potential to quickly confirm (and inform) our knowledge of, and response to, the current pandemic [1,2]. In this manuscript [3], Danesh and colleagues use the earliest set of available SARS-Cov-2 genome sequences available from France to make inferences about the timing of the major epidemic wave, the duration of infections, and the efficacy of lockdown measures. Their phylodynamic estimates -- based on fitting genomic data to molecular clock and transmission models -- are reassuringly close to estimates based on 'traditional' epidemiological methods: the French epidemic likely began in mid-January or early February 2020, and spread relatively rapidly (doubling every 3-5 days), with people remaining infectious for a median of 5 days [4,5]. These transmission parameters are broadly in line with estimates from China [6,7], but are currently unknown in France (in the absence of contact tracing data). By estimating the temporal reproductive number (Rt), the authors detected a slowing down of the epidemic in the most recent period of the study, after mid-March, supporting the efficacy of lockdown measures.
Along with the three other reviewers of this manuscript, I was impressed with the careful and exhaustive phylodynamic analyses reported by Danesh et al. [3]. Notably, they take care to show that the major results are robust to the choice of priors and to sampling. The authors are also careful to note that the results are based on a limited sample size of SARS-Cov-2 genomes, which may not be representative of all regions in France. Their analysis also focused on the dominant SARS-Cov-2 lineage circulating in France, which is also circulating in other countries. The variations they inferred in epidemic growth in France could therefore be reflective on broader control policies in Europe, not only those in France. Clearly more work is needed to fully unravel which control policies (and where) were most effective in slowing the spread of SARS-Cov-2, but Danesh et al. [3] set a solid foundation to build upon with more data. Overall this is an exemplary study, enabled by rapid and open sharing of sequencing data, which provides a template to be replicated and expanded in other countries and regions as they deal with their own localized instances of this pandemic.
References
[1] Grubaugh, N. D., Ladner, J. T., Lemey, P., Pybus, O. G., Rambaut, A., Holmes, E. C., & Andersen, K. G. (2019). Tracking virus outbreaks in the twenty-first century. Nature microbiology, 4(1), 10-19. doi: 10.1038/s41564-018-0296-2
[2] Fauver et al. (2020) Coast-to-Coast Spread of SARS-CoV-2 during the Early Epidemic in the United States. Cell, 181(5), 990-996.e5. doi: 10.1016/j.cell.2020.04.021
[3] Danesh, G., Elie, B., Michalakis, Y., Sofonea, M. T., Bal, A., Behillil, S., Destras, G., Boutolleau, D., Burrel, S., Marcelin, A.-G., Plantier, J.-C., Thibault, V., Simon-Loriere, E., van der Werf, S., Lina, B., Josset, L., Enouf, V. and Alizon, S. and the COVID SMIT PSL group (2020) Early phylodynamics analysis of the COVID-19 epidemic in France. medRxiv, 2020.06.03.20119925, ver. 3 peer-reviewed and recommended by PCI Evolutionary Biology. doi: 10.1101/2020.06.03.20119925
[4] Salje et al. (2020) Estimating the burden of SARS-CoV-2 in France. hal-pasteur.archives-ouvertes.fr/pasteur-02548181
[5] Sofonea, M. T., Reyné, B., Elie, B., Djidjou-Demasse, R., Selinger, C., Michalakis, Y. and Samuel Alizon, S. (2020) Epidemiological monitoring and control perspectives: application of a parsimonious modelling framework to the COVID-19 dynamics in France. medRxiv, 2020.05.22.20110593. doi: 10.1101/2020.05.22.20110593
[6] Rambaut, A. (2020) Phylogenetic analysis of nCoV-2019 genomes. virological.org/t/phylodynamic-analysis-176-genomes-6-mar-2020/356
[7] Li et al. (2020) Early transmission dynamics in Wuhan, China, of novel coronavirus–infected pneumonia. N Engl J Med, 382: 1199-1207. doi: 10.1056/NEJMoa2001316
DOI or URL of the preprint: https://www.medrxiv.org/content/10.1101/2020.06.03.20119925v1
Thank your for submitting your manuscript, which has now been seen by three reviewers.
In general, the reviewers found the manuscript interesting but noted several points that need clarification and further discussion. Pending these minor revisions, I think the manuscript will merit recommendation.
This manuscript presents an exhaustive phylodynamic analysis of the early phase of the French COVID-19 epidemic.
The focus is on the dominant clade (B.1) since it is the only informative one for phylodynamic analyses. The lack of sequences from the initial days of the epidemic hinders a more detailed reconstruction of the early dynamics due to lack of resolution.
Nevertheless, the results are quite strong and informative. The beginning of the French epidemic is dated within a reasonable interval (mid-January to early February) consistent with epidemiological evidence for the European epidemic.
The doubling time is also consistent with the epidemiological evidence, although with large uncertainties.
The authors also find an increase in the doubling time along the epidemic, that would be extremely interesting in terms of a slowdown due to the non-pharmaceutical interventions implemented in France. However, I wonder if either the non-uniform sampling rate or the geographical spread of the strains could have affected this result. Intuitively, both could cause an upward bias to the inferred growth rate in the early part of the tree. In my opinion, while very suggestive, the evidence presented here is not conclusive
The birth-death skyline analysis used to infer the duration of the infectious period is very intriguing. The authors find an infectious period of 4-6 days from phylodynamic evidence. Note that in the model by Stadler et al 2013, infectiousness is constant in time until individuals are not infectious anymore, while COVID-19 has a bell-like profile of infectiousness centered around 4-6 days post infection. Hence, it is difficult to assess the agreement between the result of the authors and the known generation time distribution of COVID-19. Assuming that the relevant comparison would be with the duration of the infectious period, the estimates in this manuscript would be reasonably close to the epidemiological evidence. Instead, if the relevant comparison would be the one with the relation between exponential growth rate and R0 (Lotka-Volterra equation), the model used by the authors would lead to a significant underestimation of R0 in the initial phase or an overestimation of the the infectious interval, as well as an overestimation of Rt when the epidemic is decreasing. This could be one of the reason behind the suspiciously low (although very uncertain) value of the inferred Rt in the first period of the epidemic, and the fact that Rt>1 in later phases. Anyway, the values of the infectious period and Rt are in the right ballpark.
Overall, this is a very good and clear manuscript that provides an excellent example of the power of phylodynamics to infer quantities of epidemiological interest.
https://doi.org/10.24072/pci.evolbiol.100244.rev11Danesh et al. present a study of the phylodynamics of SARS-CoV-2 sequences from France early in the outbreak. Their analysis is based on 196 genomic sequences collected early in the outbreak (January 24 - March 24 2020) and they estimate several key epidemiological parameters from the sequence data. While this work is important and timely, some clarifications would strengthen the manuscript.
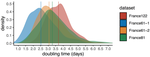
-In Figure 3, the estimated doubling time from the sequences from the second half of the epidemic (France 61-2 set) is lower than the doubling time for the sequences from the whole epidemic (France 122a) or the doubling time for the sequences from the first three quarters of the epidemic (France 81). This does not appear to be consistent with the interpretation that adding more recent sequences increases estimated doubling time. Was estimated doubling time lower at the end of the time period examined as well as at the beginning?
-The methods section states that 196 sequences are analyzed. However, 204 sequence ids are listed in Supplemental Table 1. The set of sequences used for the analysis should be clarified.
-In a few places, more detail on the methods used would be helpful. In particular, it would be helpful to provide more detail on the steps taken to align and clean the data using the augur pipeline (what parameters were used to filter and align the sequences?) Parameters used to run RDP, SMS, PhyML should be listed (where default parameters were used this should be specified). The authors should also consider including the phylogenetic tree in Figure 1 as a supplemental file.
-The motivation for the molecular clock settings chosen (above, below and equal to a previously reported value) are described only in the methods; it would be helpful to have this information in the results section when Figure 2 is discussed. It would also be helpful in the caption of Figure 2 to specify that the clock rate is in substitutions per site per year (this is also just described in the methods). Also, in Figure 2, the models should be listed in the legend in either increasing or decreasing order of clock rate (right now the slowest of the three clocks is in the middle of the legend, which is confusing).
--In the introduction (line 14), the Liu et al. reference is not the right one for the genomic sequence of SARS-CoV-2. For the initial sequencing of the virus, cite Wu et al., 2020, A New Coronavirus Associated With Human Respiratory Disease in China and Zhou et al., 2020, A pneumonia outbreak associated with a new coronavirus of probable bat origin.
Typographical suggestions:
-title: epidemics → epidemic
-line 2: pandemics → pandemic
-line 19-20: “Early results allowed to better understand the origin of SARS-Cov-2 and identify” → “Early results allowed better understanding of the origin of SARS-CoV-2 and identification of”
-line 34: “among which the temporal reproduction number” → “including the temporal reproduction number”
-line 42: “epidemics” → epidemic”
-Fig 1 legend: “because outside the main clade” → “because they are outside the main clade”
-Figure 2 legend: “fix molecular clock” → “fixed molecular clock”
-line 79: In the following of the work → in the following work
-line 87: In appendix → in the appendix
-line 95: in smaller dataset → in the smaller dataset
-line 159: “if we use a,” → delete comma
-line 234: bayesian → Bayesian (fix capitalization)
-line 250: as previous models → as in previous models
-line 264: delete comma
https://doi.org/10.24072/pci.evolbiol.100244.rev12Danesh et al. perform a phylodynamic analysis of the French SARS-CoV-2 epidemic, and notably estimate the reproduction number and the duration of infection from the phylogeny. They analyze the sensitivity of their results to the sequence sampling, and observe an effect of the lockdown on the reproduction number. The values they infer for the parameters of the epidemic agree with those of contact-tracing analyses.
I found Danesh et al.'s manuscript interesting, in particular that the phylodynamic estimates overlap with contact tracing estimates, but have a few comments and suggestions to make.
First, I found an interpretation of the phylogeny puzzling: it seems a polytomy is interpreted by the authors as evidence for multiple introductions, but I don't understand why it would be so.
Second, the sampling is uneven across French regions, with some regions entirely missing. I think the authors should address this problem, for instance by discussing its origin and its potential consequences on the estimated phylogeny and parameters.
Third, I think the manuscript can be made clearer by reorganizing some parts, and explaining some terms (see below for specific examples). Fourth, I found myself missing some technical information, for instance on the clock models that were used, on convergence diagnostics, and I would have liked to see a more systematic comparison between the prior and the posterior distributions (see below for specific examples).
My opinion is that those points should be addressed before any recommendation.
More specific comments:
p3 l55: I think it would be useful if the authors could address the lack of sequences coming from region provence Alpes Côte d'Azur. It is also a missing point in Gambaro et al., but those authors circumvented this issue by arguing that they were focusing on the epidemic in the north of France. That's not what the authors here are aiming to do, but can they still talk about the epidemic in all of France if entire regions are missing?
p4 l70: "Another interpretation, could be independent introductions in France (up to 6 events)." : I don't understand. Independent introductions would not necessarily create a polytomy, as is shown by the sequences in black. And I'm not sure where the number 6 comes from.
Fig. 1 : there seems to be a contrast between the relative number of sequences coming from Île de France in the data set and the relative number of infections or hospitalizations in Île de France. Based on the latter, I would expect many more red sequences in the phylogeny. Has there been an under-sequencing of sequences in Île de France compared to other regions ? Finally, the scattered distribution of the sequences from Île de France indicates that they may be the source of many clusters in other French regions, if the support values in the phylogeny are high enough.
Fig. 2: the legend of the distributions could be improved by indicating the unit notably.
Fig. S4: the legend needs to be improved as in Fig. S5.
Fig S3: it is not clear how the priors were specified, in particular their parameters.
p5 l90: "This was also true for the BDSKY model, where the prior shape for the recovery rate had little impact (Figure S3)": I would clarify and add something like "... but the positional parameters of the prior had an important impact."
p6 l115: the data sets (France81, France61-1) are introduced here even though they have been discussed previously when commenting on Table 1.
p6: "Since the first dataset includes more recent" : do the authors count the full dataset France 122a when writing this sentence, or do they just talk about the 3 other ones (the subsets)?
l125: "Adding more recent sequence data indeed leads to an increase in epidemic doubling time. Initially, with the first 61 sequences (which run from Feb 21 to Mar 12)": I am wondering if the doubling time is the only parameter that changes in this experiment. Indeed, altering the sequence sample may change other parameter estimates, which may be correlated with the doubling time. Besides, the sampling effort was probably not the same between before March 12 and after March 24. Are such differences in sampling effort accounted for in the model?
l130: I found this paragraph about molecular clocks confusing because it was unclear to me what clock models had been used.
Fig. S6: "convergence is limited" : what does that mean? That convergence diagnostics were charateristic of a lack of convergence of the MCMC chains?
l150-155: I think it would be useful to define what the authors mean by duration of contagiousness vs distribution of infectious periods. I assume the latter is the time between successive infections in a transmission chain, but I'd like to be sure... Also, it is not clear to me why for these estimates the authors no longer consider the influence of the priors on the rate of evolution or of sampling time.
Fig. S3, S6, S8, S9: it would help in all figures showing the impact of the prior on the posterior distributions to also display the prior distributions.
l180: "allows to infer phylogenies" : allows one to
l215: "As acknowledge in the introduction" : acknowledged
https://doi.org/10.24072/pci.evolbiol.100244.rev13