
Recommendation
The breeder’s equation is a classical equation in evolutionary theory, and basically states that the response of a trait to selection is equal to the strength of selection on this trait multiplied by the heritability of the trait. There can be several reasons why reality does not conform to a narrow interpretation of this equation, but in spite of that, let us actually indulge in a broad interpretation of the equation. Typically, the heritability of a trait is interpreted to refer to the genetic basis of a trait (the additive genetic variance). However, a broad interpretation of the breeder’s equation would be that if selection acts on a trait and that trait is somehow heritable, we should expect to observe an evolutionary change in that trait. In other words, the source and mechanism of inheritance does not matter for the breeder’s equation to have applicability.
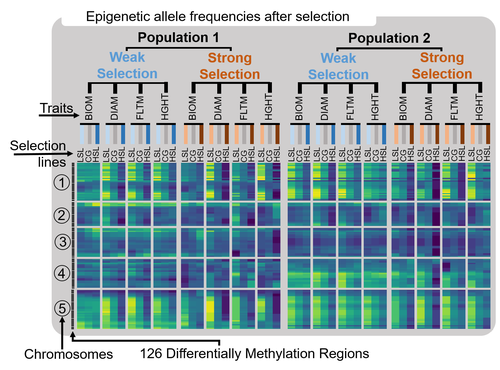
In this paper, Pujol et al. (2025) follow this rationale for epigenetic variation, and more specifically for differentially methylated regions in the model plant Arabidopsis thaliana. They used 120 lines which vary across 126 differentially methylated regions of the genome, but are genetically identical, thereby eliminating additive genetic variance from the heritability component of the breeder’s equation. Previous studies have already shown that these differentially methylated regions are associated with different phenotypes, suggesting they somehow functionally affect the development of the plants. Previous studies have also shown that these differentially methylated regions are stably transmitted across generation, i.e., that they are heritable. This predicts that if one selects for different phenotypes, there should be an evolutionary response in the phenotypes, and an associated shift in the differentially methylated regions that are responsible for the phenotypic variation.
By and large, this is what Pujol et al. (2025) found. They selected divergently on four different plants traits (biomass, rosette size, flowering time, and height at first fruit), in two different populations, and with two different selection strengths. For most traits they found a phenotypic shift, and this largely corresponded with associated shifts in the differentially methylated regions. The patterns were very congruent between the different selection strengths, and very similar for the two different populations. We can therefore confidently conclude that epigenetic variation has effects on fitness-relevant phenotypic traits, that therefore natural selection can act on this epigenetic variation, and if so that this would cause an evolutionary change in the phenotypes under selection and in the differentially methylated regions causing this phenotypic variation. I.e., the breeder’s equation can indeed by applied to more than just genetically heritable variation, it can also be applied to non-genetically heritable variation.
While this seems like a very obvious result, there are still very few studies that show how selection on non-genetic heritable variation results in a between-generation shift in this non-genetic heritable variation. In that sense, this study can function as a case in favour of a broader interpretation of evolution; to refer to a heritable between-generation change in the composition of a population, independent of whether the heredity is genetic or non-genetic. Critics might say that this study has only limited validity, since the epigenetic variation has been artificially increased in the used plant lines, and may not reflect naturally occurring variation. Indeed, more studies on natural selection on epigenetic variation are called for, but these will have the added complication that they need to correct for genetic variation, which is often correlated to epigenetic variation. Here, the authors could exclude genetic variation by working with epigenetically different lines that were genetically identical.
The study stands out in yet another respect – it uses a highly unusual and apparently novel selection design (although the authors do not know for sure if their idea is actually novel). Typically, in a selection study only a subset of parents is allowed to reproduce out of the total set of potential parents. If one wants to select for different traits separately, or with different selection strengths, separate selection studies need to be undertaken. Here the authors took a different approach. They let all their parents reproduce (3 offspring per plant), and phenotyped all offspring. They then, virtually, selected for different traits or for different selection strengths in the parents by excluding from their dataset the offspring of parents that are selected not to reproduce – after they had actually already reproduced! It is almost as if selection acts with a time delay, destroying not only the selected parents but also their offspring. This has the benefit that a single dataset is generated (all phenotyped offspring of all parents), and then selection can be exerted as often as one wants, for example for distinct types of selection, or on different (combinations) of traits. While the initial effort to phenotype offspring of all potential parents is large, and exponentially so if multiple generations are selected, the subsequent evaluation of distinct types of selection on any of the phenotyped traits is virtually effortless. For example, the authors applied divergent selection, but could reuse their dataset to apply stabilising selection. This novel selection design may therefore be a very attractive approach for many other researchers.
References
Benoit Pujol, Mathieu Latutrie, Pierick Mouginot, Nelia Luviano- Aparicio, Jésaëlle Piquet, Sara Marin, and Stéphane Maury (2025) Experimental evidence for short term directional selection of epigenetic trait variation. Zenodo, ver.2 peer-reviewed and recommended by PCI Evolutionary Biology https://doi.org/10.5281/zenodo.15227609
DOI or URL of the preprint: https://doi.org/10.5281/zenodo.12759764
Version of the preprint: 1
https://doi.org/10.5281/zenodo.15227609
Dear recommender, thank you for your comments and the opportunity to submit a revised version of out preprint to PCI Evol Biol. We greatly appreciate the comments that were made by you and by the reviewers and took all of them into account, which greatly improved the paper, in particular by enriching the discussion section.
Please find below a point by point response to each comment. We have submitted a version of the paper that locates all the reviewers’ comments and yours in the margin, and where modifications to the text appear in red (file name ends with COMMENTS). We also uploaded a clean version of the revised text (file name ends with CLEAN).
COMMENTS BY PIM EDELAAR
PE1 L. 115: another way to describe this is that survival selection acted on offspring based on the phenotype of their parents, almost as a delayed operation of natural selection
You use the same data set to perform different selection trials. I am not quite sure how independent these trials are though. Any specific outcome (partly based on random effects like stochasticity or mutation) would be present in all trials. Has anyone else used this approach to study the effects of selection? If so, please provide some more discussion and references.
>>Reply : we modified the text at the end of the introduction accordingly and paraphrased the text of the comment, which we hope you won’t mind. We hope that these changes clarify that although the source population is the same, and therefore the data cannot be fully independent, selection trials based on the same population could be conducted on different traits.
PE2 L 234: why is this conservative?
>>Reply : we added text to clarify that we based our claims for a significant difference on the condition that Confidence Intervals did not overlap. By definition, p values indicating a significant difference allow some overlap between Cis. We therefore qualified our approach as conservative because only a strongly significant difference would be considered different.
PE3 L 254: I don´t really see why you need a control group. Why not simply established two selection lines, and compare each with the entire pool of potential parents? This is how I usually think about the selection differential, as the difference between potential (all) and actual reproducers. With your approach, they are exclusive collections, instead of a subset. This also means that some parents with extreme values end up exclusively in the control group and can therefore not be in the selection lines. This is not wrong, but it makes your selection weaker.
>>Reply : we chose to oppose the selected parents to a control group randomly sampled in the parental population, to produce a selection design in silico that is similar to having the a parental control group of real plants isolated from the selection lines before plants get to be trialed by means of survival or reproduction. As a result, similar precision is expected between S and R estimates. Bias in the estimate of S caused by including extreme values in the control group that can therefore not be in the selection line, is not expected to affect our results and their precision because we resampled randomly the control group a thousand times. We chose not to modify the approach and the text because using the mean phenotype of a random sample of the parental population versus the full parental population is correct and not supposed to bias our results.
PE4 L 251: why do you say typically, was it sometimes done differently? Why do you say estimated, was it not simply calculated?
>>Reply : we removed “typically” and replaced “estimated” by “calculated” in this paragraph
PE5 L 253: there is no information on how R was obtained. Given that you have three offspring per parent, and we want independent experiments, there is an argument to be made that only one random offspring per parent is used for any round of calculations
>> Reply : Thanks for pointing the lack of information on hor R is obtained. As already mentioned in the text : “R was calculated by the difference of mean trait value between the selection line and control line in G1, which allows controlling for potential between-year environmental variation of the mean phenotype”. As mentioned in the “selection experiment” paragraph, every parental plant had three progeny. We added text in the “selection experiment” paragraph to mention that G1 lines were made up of the three progeny of their corresponding parents.
PE6 L 272: was each of these PCs still significant? What criterion did you use to determine how many PCs to maintain? You later use only the first PC, so maybe just mention that?
>> Reply : We clarified this aspect in accordance with your comment by adding text in the result section “Epigenetic signature of selection”. In fact, we tested the statistical significance of every PC, for every trait, in the two populations. We only displayed results for PC1 because other statistically significant PCA coordinates explained very little variation.
PE7 The results section has some introductory material, that should be integrated with the introduction or the methods. For example, L 384-385, L 394-396, 408-410, 418-419, 440-454. L 465-471 is better suited for the discussion.
>> Reply : L384-385 was transferred to the introduction, at the beginning of the 2nd paragraph , L 394-396 was transferred to the 1st paragraph of the methods section, L 408-410 was transferred to the 2nd paragraph of the introduction, L 418-419 was transferred to the 2nd paragraph of the “Analysis of molecular epigenomic integrity” part of the methods section, L 440-454 was transferred at the end of the “Analysis of molecular epigenomic integrity” part of the methods section, L 465-471 was transferred to the end of the discussion (one before last paragraph).
PE8 This mixture of types of text is very common throughout, I give more indications below but please revise the text entirely with a focus on this. I personally don´t necessarily mind a creative mix of contexts if it serves comprehension, but here it largely does not seem necessary, and it in fact creates some duplication on information.
>> Reply : We read through the text to reduce mixture, and remove duplication. Thanks for pointing this out. The manuscript was originally written in letter format where methods are presented at the end of the paper. A synthetic explanation of the methods was needed in the results section to clarify what was done. We had forgotten to remove these duplicates when moving the detailed methods section before the results section.
PE9 L 475: why is flowering time a morphological trait, and height of first silique not?
>> Reply : thanks for pointing out this error, flowering time was mentioned in both morphological and reproductive trait categories when it is clearly a reproductive trait. We corrected this problem.
PE10 L 473-502 is all methods, not results
>> Reply : A part of the corresponding text was inserted in the “Selection experiment phenotypic” part of the methods section (with the accompanying Figure), while another part of this text was inserted in the “selection analysis” part of the methods section, and another redundant part of this text was removed.
PE11 L 508: why don´t you perform traditional statistical tests to determine significance? Alternatively, you could simply visualise per trait the distribution of the difference between the two selection lines, and let that speak for itself without doing any statistics (just report the proportion of cases when the difference is equal or lower than 0 – similar to Bayesian posterior distribution)
>> Reply : Interestingly, we considered these two options.
The first option was rejected because of our “bootstrapping” approach. We have nothing against traditional statistical tests used in experimental selection that are between-group mean comparison tests (e.g., LM models). They are used to compare two or three groups (selection lines and control line) but only once because the selection experiment is done only once. We chose to use a CI comparison because we could obtain it directly after bootstrapping ‘in sillico’ our 1000 random samplings of control groups (which avoids any potential sampling bias when the control group is only chosen once). This approach gave us all the information that we needed.
We totally agree that this second option would have been perfectly suited to our “proof of concept” test of the epigenetic response to trait selection. This is in fact very close to what we have done since visualizing the distance between distributions is very similar to comparing their 95%CIs. We thought about comparing the divergent selection lines (low vs. high selection lines) instead of comparing each of them to a control. I’ve used the approach that you suggested in previous work and it is very efficient. However, the conclusion of collective meetings with the team and external researchers was that there is a general interest for results detailing the upward and downward selection of the four plant traits that we measured. This is because the downward and upward selection regimes were not expected to provide equivalent responses to selection, have different biological implications, and these traits are widely studied in the plant literature.
PE12 L 508-514 are methods and discussion
>> Reply : Thanks for your patience in pointing out the duplicates in our paper, that are the remains of the former letter format of this paper. Much appreciated. We removed this redundant content.
PE13 L 527-534: a mixture of methods and discussion
>> Reply : we modified the text accordingly. The methods sentence was moved accordingly to the suggestion of the reviewer (SMB comment 13) and the rest of the text, which was discussing the results of the phenotypic selection experiment, was moved at the end of the first paragraph of the discussion.
PE14 Table 1: you don´t specify what NS and N/A are, although I can guess. Either way, those values can be calculated and should be reported, even if your approach does not find them to be statistically significant.
>> Reply : We reported these values, removed the NS and N/A and put statistically significant responses to selection and heritability estimates and selection differentials (that are true estimates) in bold.
PE15 L 553-561: discussion
>> Reply : We removed redundancy and moved the remaining text corresponding to the changes in epigenetic allele frequency at DMRs observed after selection on the heatmap to the discussion. We placed it after the text on the integrity of the genome structure and before the text on the hypermethylated changes associated with upward trait selection
PE16 Fig. 2: I think the circles with 1,2 etc. before “Chromosomes” can be removed, I found that actually confusing. Otherwise a very nice figure
>> Reply : We removed the circles before “Chromosomes” and it looks indeed simpler and nicer like this. Much appreciated.
PE17 L 589-594: discussion
>> Reply : We moved this text about the statistically significant epigenetic response to selection to the discussion, after the text on the integrity of the genome and before the discussion of the heatmap that displays changes in epigenetic frequencies at DMRs
PE18 L 608: how about “Theory predicts that selection can also act on transgenerational epigenetic variation, even without a contribution of genetic variation”
>> Reply : the text was modified accordingly
PE19 L 612: contributes
>> Reply : corrected accordingly
P20 L 616: this paragraph goes better after the next one
>> Reply : This paragraph was moved accordingly
P21 L 623: a range of
>> Reply : corrected accordingly
Review by Sophie Brunel Muguet
Abstract
SBM 1 In the abstract expression “in real time” is not intuitive here. The authors should clarify what is the idea behind. Also, unless I missed something, the selection was tested for 4 growth and flowering related traits and not only rosette size and plant height as it is mentioned in the abstract.
>> Reply : “in real time” was removed and replaced by “rapidly” we completed the list of four traits
Introduction
General comments
SBM2 The introduction provides many references that are useful to justify the context of the study and the associated questions. Nevertheless, I believe that is that several of them do not exactly illustrate the meaning of the sentence.
For instance, p.1 lines 43-44, the main highlights in Stajic et al. (2019) are that “short term epigenetic inheritance may interact with genetic changes by modifying the rate and type of adaptive mutations”. This could be used further in the discussion. Unfortunately, we cannot see if the reference was used later in the text because from the Material and Methods, the references are numbered. We can assume that they follow the order in the References List but this has to be fixed.
>> Reply : there was indeed a formatting issue with the references, thank you for pointing this out. Some of them did change back to the previously used numbered format from a former version of the MS (letter type format). We have no idea why the software did this. We read through the text and fixed that mistake. We checked that the reference list at the end was correct. Thanks for pointing the issue with the Stajic and Perfeito 2019 citation. There was a mix up with the Stajic and Jansen 2021 citation. This is now corrected. We checked the rest of the MS and did not find any similar issue.
SBM3 My other concern is about the use of “transgenerational”. I guess that the authors should give one or two references that define it. It seems that throughout the text, the term transgenerational is used irrespectively to describe inheritance in experimental designs that imply a two or more generations. To my knowledge, Lamke and Baurle (2017) provided a straightforward distinction between trans- and intergenerational inheritance and the present design seems to fall into the later.
>> Reply : Thanks for your comment. We read through the paper but found only correct uses of the term transgenerational (theory, references, epiRILs). We fully agree that our selection experiment was intergenerational but it is important to note that the epigenetic trait variation in epiRILs is transgenerational. As you know, it has been proven to be stable across several generations.
Other minor comments:
SBM4 -p2, l.58-62: split the sentence
>> Reply : Done
SBM5 -p2, l.66-68: specify that it has never been done before (e.g. Schmid et al. 2018)
>> Reply : We added text to clarify this point, cited Schmid et al and mentioned that they had found a signature of population epigenetic divergence attributed to selection.
SMB6 -p2, l.78: add These “EpiRILS are a set…” to make the link with the previous sentence.
>> Reply : Done
SMB7 -p2, l.83: “We therefore expect that a selection differential imposed to…” Edit the sentence
>> Reply : Thanks for pointing this out. We have edited and simplified the sentence, which now reads better.
Materials and methods
General comments
As being non-familiar with the procedure of such analyses, I can not edit this part. Nevertheless, for non-specialist it looks detailed and the attempts to justify concerns about the samplings of the two populations and the consequence on the reliability of the statistics are convincing. I believe that the approach based on two selection pressures (“weak” and “strong”) is a solid added value to the experimental design.
>> Reply : Thank you, much appreciated
SMB8 Nevertheless, the fact that the two populations P1 and P2 were not tested at the same time raises the question of the condition of storage of the seeds used to produce G0. The authors should describe the storage conditions and justify that no effects of the seedlots from the two populations could have interfered or overruled the selection effects tested in each population.
>> Reply : Thank you for pointing out this concern. We had thought about it but had not included it in the text to limit the amount of details. We now address this point in the text by describing storage conditions (dry conditions, under 20°C) in the “plant material” section of the methods, and by addressing the potential effect of differential seed storage periods on the discrepancy between selection in populations 1 and 2 in the “phenotypic response to selection” section of the results. Selection results were remarkably similar between population 1 and 2. The difference was that population 2 G0, which is characterized by 6mo longer seed storage, and is made of a different set of epiRILs, had a non-significant response to weak selection for flowering time. The potential effects of the difference in epiRIL composition and storage time therefore cannot be separated. We therefore mention both these potential explanations of this discrepancy.
SMB9 [about the different periods at which P1 and P2 were grown, and whether there was an effect on seeds] caused by storage] In relation with the results on selection for earlier and later flowering plants (p. 14-15) and the observed differential responses to selection between the two population, this could be discussed.
>> Reply : We added text in the “phenotypic response to selection” section, in accordance with the comment “SMB8”. It is important to note that in the “epigenetic signature of selection” section, the lack of epigenetic response was similarly found in both populations 1 and 2.
SMB10 Did the authors notice difference in germination rates between the two populations?
>> Reply : We did not notice germination rate differences in the two populations. In each of the two populations, that were sown 6mo apart, germination occurred simultaneously on the 6th day after sowing.
SMB11 Otherwise, I guess that the Figures 1a and b could be cited here.
>> Reply : Thank you for pointing this out, we positioned Figures 1a and b in the “selection experiment” section of the methods, in accordance with your comment and the comment PE10 of the editor.
Results
General comments
The results section is nicely presented with dedicated sub sections notably on phenotypic response to selection and epigenetic signature of selection. These results are consistent and highlight evidences of epigenetic-driven features of selection in a similar genetic background.
>> Reply : Thank you for this supporting comment, much appreciated
SMB 12 The four characteristics tested displayed different response to selection which could be further discussed.
>> Reply : We added text at the end of the first paragraph of the discussion about the response to selection of the four characteristics. We expected and observed a response to selection in height, and flowering time (even though partly). We did not expect it for biomass, which did not change in response to selection. We were surprised to observe a response for the rosette diameter which had been found to have a very low heritability in Roux et al. 2011.
Other minor comments:
SMB13 -p12, l.31-32: “Heritability…to selection” should be moved further above l.22 when first presenting the results on heritability. For instance, Heritability which is the heritable part (…) was estimated…”.
>> Reply : corrected accordingly
SMB14 -p14, l.80: Thus, the divergent selection for rosette wider and narrower rosette…”
>> Reply : Thanks for pointing this out, we corrected the sentence by removing the first “rosette”
Discussion
General comments
The discussion is short but summarized the main results. The limitations of the study and the perspectives are explained in a dedicated sub section. I believe that the experimentation was nicely designed to reach the objective of the study.
>> Reply : Thank you for your comment, much appreciated.
SMB14 Perspective of selection over 2 generations could have been mentioned, as truly transgenerational studies, thus highlighting the need of high throughput phenotyping and epi-genotyping.
>> Reply : We agree and added text at the end of the second paragraph of the discussion to mention that stable transgenerational epigenetic trait variation should in theory allow populations to respond to selection over several generations but that many mechanisms underlying the epigenetic response to selection remain unknown and require demanding studies involving high throughput phenotyping and epi-genotyping.
Review by Leandro Quadrana, 13 Oct 2024 11:32
Using epigenetic recombinant inbred lines (epiRILs) in the model plant Arabidopsis thaliana, it has been well established that DNA methylation changes contribute to heritable trait variation independently of DNA sequence variation. Theory predicts that heritable variation can be subject to selection, but, although highly anticipated, whether epigenetically-determined heritable variation responds to selection has not been formally tested.
This work investigates the response to artificial selection of variable traits in the epiRILs. By selecting lines with contrasting phenotypes, the authors demonstrate that this process leads to phenotypic shifts in the next generation. Drawing on previously published epihaplotypes, which were further validated here for some lines, the study inferred the epigenetic changes in the selected populations and found that changes in traits corresponded with alterations in DNA methylation profiles. Overall, the selection responses align with the heritability of the traits.
>> Reply : Thank you for this accurate interpretation of the research we conducted in this study.
An interesting aspect of this work is that, rather than performing actual selection and propagation of selected individuals, the authors propagated and phenotyped all the offspring, then simulated selection based on the collected data. This approach allowed them to explore the response to selection for multiple phenotypes in the same population, as well as test different selective strengths and the robustness of their simulations through bootstrapping. One limitation of this method is its wide application as it requires the propagation and study of all offspring, which results in very large numbers of individuals that may be challenging in other species, such as crops.
>> Reply : Thank you for this comment. We were quite enthusiastic when we came up with this idea. We could not find any other study using a similar approach but we made sure not to claim that we were the first to come up with it because it is not sure. It is a rather interesting protocol that allows to conduct simultaneous selection on several traits in the same population. You are right to mention that it was indeed demanding in terms of logistics. We think that it could quickly become unmanageable over several generations.
The manuscript effectively shows that epigenetically-driven heritable phenotypes can be artificially selected, a conclusion well-supported by the classical breeder’s equation.
>> Reply : Thank you for your comment that supports our conclusion
LQ1 Minor comment: Please format the reference section to include reference numbers.
>> Reply : Thank you for pointing out this issue with the formatting of the references that finds its origin in the former version of this paper being formatted to be a research letter. We corrected the problem and all the citations now share the same regular (name et al. year) format.
 , posted 23 Oct 2024, validated 24 Oct 2024
Dear authors,
Two reviewers and I have now evaluated your manuscript (it took a while - the summer break did not help to find reviewers it seems). While we all find it interesting and relevant, and the study is largely done well, there are also several comments which I feel could improve the ms further and addressing these would bring it up to the level that would likely warrant its recommendation.
The comments of the two reviewers should be automatically attached, and I presume also the instructions to perform and submit the revision. So I will here only paste my own comments.
L. 115: another way to describe this is that survival selection acted on offspring based on the phenotype of their parents, almost as a delayed operation of natural selection
You use the same data set to perform different selection trials. I am not quite sure how independent these trials are though. Any specific outcome (partly based on random effects like stochasticity or mutation) would be present in all trials. Has anyone else used this approach to study the effects of selection? If so, please provide some more discussion and references.
L 234: why is this conservative?
L 254: I don´t really see why you need a control group. Why not simply established two selection lines, and compare each with the entire pool of potential parents? This is how I usually think about the selection differential, as the difference between potential (all) and actual reproducers. With your approach, they are exclusive collections, instead of a subset. This also means that some parents with extreme values end up exclusively in the control group and can therefore not be in the selection lines. This is not wrong, but it makes your selection weaker.
L 251: why do you say typically, was it sometimes done differently? Why do you say estimated, was it not simply calculated?
L 253: there is no information on how R was obtained. Given that you have three offspring per parent, and we want independent experiments, there is an argument to be made that only one random offspring per parent is used for any round of calculations
L 272: was each of these PCs still significant? What criterion did you use to determine how many PCs to maintain? You later use only the first PC, so maybe just mention that?
The results section has some introductory material, that should be integrated with the introduction or the methods. For example, L 384-385, L 394-396, 408-410, 418-419, 440-454. L 465-471 is better suited for the discussion.
This mixture of types of text is very common throughout, I give more indications below but please revise the text entirely with a focus on this. I personally don´t necessarily mind a creative mix of contexts if it serves comprehension, but here it largely does not seem necessary, and it in fact creates some duplication on information.
L 475: why is flowering time a morphological trait, and height of first silique not?
L 473-502 is all methods, not results
L 508: why don´t you perform traditional statistical tests to determine significance? Alternatively, you could simply visualise per trait the distribution of the difference between the two selection lines, and let that speak for itself without doing any statistics (just report the proportion of cases when the difference is equal or lower than 0 – similar to Bayesian posterior distribution)
L 508-514 are methods and discussion
L 527-534: a mixture of methods and discussion
Table 1: you don´t specify what NS and N/A are, although I can guess. Either way, those values can be calculated and should be reported, even if your approach does not find them to be statistically significant.
L 553-561: discussion
Fig. 2: I think the circles with 1,2 etc. before “Chromosomes” can be removed, I found that actually confusing. Otherwise a very nice figure
L 589-594: discussion
L 608: how about “Theory predicts that selection can also act on transgenerational epigenetic variation, even without a contribution of genetic variation”
L 612: contributes
L 616: this paragraph goes better after the next one
L 623: a range of
Let us know if there are any problems or if anything is unclear, and best wishes.
, 13 Oct 2024Using epigenetic recombinant inbred lines (epiRILs) in the model plant Arabidopsis thaliana, it has been well established that DNA methylation changes contribute to heritable trait variation independently of DNA sequence variation. Theory predicts that heritable variation can be subject to selection, but, although highly anticipated, whether epigenetically-determined heritable variation responds to selection has not been formally tested.
This work investigates the response to artificial selection of variable traits in the epiRILs. By selecting lines with contrasting phenotypes, the authors demonstrate that this process leads to phenotypic shifts in the next generation. Drawing on previously published epihaplotypes, which were further validated here for some lines, the study inferred the epigenetic changes in the selected populations and found that changes in traits corresponded with alterations in DNA methylation profiles. Overall, the selection responses align with the heritability of the traits.
An interesting aspect of this work is that, rather than performing actual selection and propagation of selected individuals, the authors propagated and phenotyped all the offspring, then simulated selection based on the collected data. This approach allowed them to explore the response to selection for multiple phenotypes in the same population, as well as test different selective strengths and the robustness of their simulations through bootstrapping. One limitation of this method is its wide application as it requires the propagation and study of all offspring, which results in very large numbers of individuals that may be challenging in other species, such as crops.
The manuscript effectively shows that epigenetically-driven heritable phenotypes can be artificially selected, a conclusion well-supported by the classical breeder’s equation.
Minor comment: Please format the reference section to include reference numbers.
