
Recommendation
 based on reviews by Pedro Simões and 1 anonymous reviewer
Each individual multicellular organism, each of our bodies, is a small universe. Every living surface -skin, cuticle, bark, mucosa- is the home place to milliards of bacteria, fungi and viruses. They constitute our microbiota. Some of them are essential for certain organisms. Other could not live without their hosts. For many species, the relationship between host and microbiota is so close that their histories are inseparable. The recognition of this biological inextricability has led to the notion of holobiont as the organism ensemble of host and microbiota. When individuals of a particular animal or plant species expand their geographical range, it is the holobiont that expands. And these processes of migration, expansion and colonization are often accompanied by evolutionary and ecological innovations in the interspecies relationships, at the macroscopic level (e.g. novel predator-prey or host-parasite interactions) and at the microscopic level (e.g. changes in the microbiota composition). From the human point of view, these novel interactions can be economically disastrous if they involve and threaten important crop or cattle species. And this is especially worrying in the present context of genetic standardization and intensification for mass-production on the one hand, and of climate change on the other.
With this perspective, the international team led by Amandine Cornille presents a study aiming at understanding the evolutionary history of the rosy apple aphid Dysaphis plantaginea Passerini, a major pest of the cultivated apple tree Malus domestica Borkh (1). The apple tree was probably domesticated in Central Asia, and later disseminated by humans over the world in different waves, and it was probably introduced in Europe by the Greeks. It is however unclear when and where D. plantaginea started parasitizing the cultivated apple tree. The ancestral D. plantaginea could have already infected the wild ancestor of current cultivated apple trees, but the aphid is not common in Central Asia. Alternatively, it may have gained access only later to the plant, possibly via a host jump, from Pyrus to Malus that may have occurred in Asia Minor or in the Caucasus. In the present preprint, Olvera-Vázquez and coworkers have analysed over 650 D. plantaginea colonies from 52 orchards in 13 countries, in Western, Central and Eastern Europe as well as in Morocco and the USA. The authors have analysed the genetic diversity in the sampled aphids, and have characterized as well the composition of the associated endosymbiont bacteria. The analyses detect substantial recent admixture, but allow to identify aphid subpopulations slightly but significantly differentiated and isolated by distance, especially those in Morocco and the USA, as well as to determine the presence of significant gene flow. This process of colonization associated to gene flow is most likely indirectly driven by human interactions. Very interestingly, the data show that this genetic diversity in the aphids is not reflected by a corresponding diversity in the associated microbiota, largely dominated by a few Buchnera aphidicola variants. In order to determine polarity in the evolutionary history of the aphid-tree association, the authors have applied approximate Bayesian computing and machine learning approaches. Albeit promising, the results are not sufficiently robust to assess directionality nor to confidently assess the origin of the crop pest. Despite the large effort here communicated, the authors point to the lack of sufficient data (in terms of aphid isolates), especially originating from Central Asia. Such increased sampling will need to be implemented in the future in order to elucidate not only the origin and the demographic history of the interaction between the cultivated apple tree and the rosy apple aphid. This knowledge is needed to understand how this crop pest struggles with the different seasonal and geographical selection pressures while maintaining high genetic diversity, conspicuous gene flow, differentiated populations and low endosymbiontic diversity.
References
DOI or URL of the preprint: https://www.biorxiv.org/content/10.1101/2020.12.11.421644v2
Version of the preprint: 2
Dear editor,
Please find attached our answer to review. I wanted to upload the new supplementary material but I am not sure where I can do it?
Thanks,
Sincerely,
Amandine Cornille
, posted 23 Aug 2021Dear Authors
first of all, please apologise for the too long time between the reviewers’ response and this answer of mine.
In the current revision of their manuscript, Olvera-Vázquez and coworkers have addressed most of the points raised during the first PCI review round. Most of the questions have been properly addressed, and I think the review process has helped clarify the message. Nevertheless, I consider that a number of questions still remain confusing in my eyes and that still require to be elucidated, as detailed below:
-Treatment of admixed individuals.
The authors were unable to assign 175 individuals (a third of the total individuals analysed) to any of the five genetic clusters. These individuals were thus not included in any further analyses. The large number of admixed individuals raises an important concern for the pertinence and interpretation of subsequent analyses. This possible caveat needs to be properly identified and a clear word of caution must be raised in the discussion and possibly in the abstract. The implication of the heterogenous distribution of the admixed individuals in the RF-ABC approach needs also to be explicitly stated.
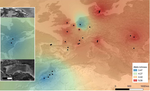
I think an indication of the geographical distribution of these admixed individuals is needed. I pointed this in my previous decision and the authors answered “We believe that the map Figure 2 is already presenting those results. The Western European and Spanish genetic clusters are the most admixed, as shown in the mean membership coefficient per site”. I am afraid I disagree with this answer: nothing in figure 2 indicates the geographical distribution of the admixed individuals. From data presented in FigS6 it seems that the number of admixed individuals is not evenly distributed across sampling sites. For instance, samples collected in the USA, Morocco or Romania seem to contain less admixed individuals than samples from France. (Note: it may be that the admixed individuals have been included for the analyses depicted in Figure 1, but this is unclear.)
I suggest that the authors include in the pie charts in figure 2c a sixth category corresponding to the admixed individuals. I would also suggest to avoid overlapping the pie charts (the precise location is given elsewhere) and to make the individual size of each pie chart proportional to the total number of individuals analysed in the sample site.
The 3-D PCA is unclear (as any 3-D representation is). I would suggest to present instead two 2-D representations of PC1vsPC2 and PC1vsPC3. This may help highlight the apparently true isolation of the blue genetic cluster and may also help visualise the apparently intermediate location of admixed individuals between the green and red genetic clusters.
-distribution of samples used for 16S rDNA analyses.
I understand from the answer to my comment that the authors are aware of the lack of representation of certain geographical regions in these analyses. For the sake of clarity and to avoid generalisations, I would suggest to make it explicit in the discussion what geographical locations were undersampled for metagenomics or not included with respect to the aphid genome markers.
-regarging isolation-by-distance analyses.
The Sp-based analyses have been performed using only the individuals allocated to one of the five genetic clusters, and the same seems to hold true for results in Fig S11. However, this analysis should probably be performed using all individuals in each orchard, including the admixed ones. Please include in the figure the results for the fit that are included in the text (F value, P value, R2). I would also recommend to perform the linear fit without the most distant sampling sites in the USA, and also probably to perform the linear fit only for the European samples. Please specify also the units for the x-axis.
, 13 Jun 2021I have now gone through the revised version and I am satisfied with this revised version and the answers provided by the authors to my comments. I have no further comments to add.
The authors have addressed most of my comments, and I appreciate their careful revisions. I have only a few minor suggestions:
L198: Change "America" to "North America"; (this is the instance I was referring to in previous review regarding L203.)
L203: change "alternate" to "alternates"
"We also continued utilizing the north-east and south-west because we were describing a pattern from one area to the other in lines 572-573-578." I do not insist (because the meaning is clear), but correct English usage is "northeast" and "southwest" without the hyphen.
Table 1: The issues with the use of "n.s." in the table have not been addressed and are still a problem. Comment from the previous review: "Only one entry in the Sp column is marked as 'n.s.'. Does this mean all the other entries are significant? Usually significant values are marked with an asterisk or other superscript (as is done for Fis in this table), and non-significant values are left unmarked. So this Sp column and the values in the last two columns of the table being marked as n.s. or left unmarked is disorienting and unconventional, and should be changed."
L842-843: abbreviate the genus name of the six listed Dysaphis species as "D." instead of spelling out each time. Same for D. reaumuri and D. pyri in L846.
L845: change "pears including," to "pears, including"
L891: change "species, are" to "species are"
DOI or URL of the preprint: 10.1101/2020.12.11.421644
Version of the preprint: 1
, posted 29 Jan 2021In this text Olvera-Vázquez and coworkers present an exhaustive analysis of the genetic diversity of Dysaphis plantaginea, an economically important pest of the cultivated apple. The authors have targetted three loci by Sanger sequencing, have used 30 SSR markers and have sequenced a small fragment of the 16 rDNA of the aphids’ endosymbionts, on over 660 samples from North America, North Africa and Europe. The authors have then applied phylogenetic inference, genetic population analyses and random-forest algorithms to try to infer the evolutionary history of this species, and geographic progression and the colonisation advancement and possible bottlenecks. Unfortunately, the authors were not able to obtain samples from Eastern and Central Asia, which has hampered a global response to the question of the origin and expansion routes of this aphid (but see below on the presence of Iranian samples in their dataset). Together with the two reviewers, I agree that the data and the approaches used are appropriate to address the question, which is interesting from a fundamental as well as from an applied perspective. Nevertheless, and also together with the reviewers, I identify some instances in which the logic of the question is unclear, while in other instances the data and methods are not fully exploited. I recommend the authors to address all the points raised by the reviewers, as well as those listed below. ______ The two Iranian Dysaphis samples are not monophyletic and distant from all other D. plantaginea samples. I would suggest to verify that this sister position in the tree is consistent for all three markers used. Also, I am not sure I understand the authors’ choice to not have genotyped these two samples. The authors say that “Those two samples were not included in the population genetics analyses using SSR, as we only had two representants (representatives) from this Caucasian region (Table S1).” But in table S1, besides these two samples, there are seven samples taken in Iran, at a single location, that have been used for the bacterial 16S characterisation and one of them also for the three-loci sequencing. I think the authors could/should include in the genetic analyses at least these seven samples, and most likely the two more divergent ones. The authors use different algorithms for inferring genetic populations among their individuals. For the 582 individuals genotyped the authors are able to allocate 407 them into one of five different genetic populations. The authors present a bimodal distribution of population probability assignment in S10 to substantiate their threshold choice for the probability of assigning one individual to a population. It is however unclear whether the presented values are all probabilities (i.e. 5*582) or only the maximum values for each individual. A clarification is needed, as the interpretation of the bimodality would differ. In their classification algorithm the authors do not present anymore the data regarding the geographical distribution of the “admixed” individuals. A description and a discussion of the homo/heterogeneity in the geographical distribution of the admixed individuals could be needed. Also, a presentation in the main text of (for instance) the K5 in Fig S6, before and after having masked the admixed individuals may also be needed and useful for interpretation. The authors present in Fig 2D a PCA to display the relationships between the genotyped individuals. A proper description is needed here, because the nature and number of the variables displayed is missing. This information is essential, because the fraction of information explained by the two axes shown is very low (the third axis is displayed without this information). This suggests that the number of dimensions per individual is very large, but is very unclear. These dimensions cannot be the probabilities assigned per individual to belong to each of the five populations (which could be also an appropriate representation). They also cannot be the 29 SSR used, which could be the other option. I guess they are the actual genetic data retrieved but this needs clarification. I have then a problem with the table used to calculate the Fst table in Fig 2e. The values have been calculated for the five genetic populations identified, but I am not convinced that the level used to estimate Fst (the inferred five populations) is the appropriate one, instead of having used the locations as the level of integration to estimate genetic differentiation. The authors have amplified and sequenced a small 251bp stretch of the 16 rDNA for 175+3 aphid extracts. I have a problem with the distribution of the samples used for 16S sequencing: the authors claim that these 175 samples “represent the range of our sampling”, but I am not sure I agree. From table S1 I understand for instance that no sample from Morocco has been submitted for 16S sequencing. Also, the authors claim that “92 % of the reads were assigned to a single B. aphidicola OTU, which was found associated with all D. plantaginea”, but this OTU is absent from five Iranian samples. Overall, I think that the analyses of endosymbiont diversity are not really exploited. An attempt of trying to link the endosymbiont diversity to local clusters, e.g. the presence and meaning of Stenotrophomonas in four French samples, and the presence of Serratia in samples from France, Iran and Spain (incompletely described in the text in L713), or to the genetics of the host would be welcome here. Additional comments. In some instances the figures mentioned do not exist (e.g. L684, pointing to Figure 3c) or do not match the one referred to (e.g. L628, pointing to FigS11). Also in some instances the dimensions and the variables plotted in the different axis are unclear (e.g. “distance” in fig S11, “proportion of assignation” in fig S10. L300-309: Please describe how manual corrections to chromatograms were introduced and how often they were required. Please mention in paragraph in line 292 that trpB was also sequenced.
, 11 Jan 2021This is a very interesting study that deals with a quite important topic, the dynamics of colonizing events and the associated genetic changes in populations at a wide geographical scale. It is even more relevant in the case of crop pests, as occurs in the present study. In general, I found the manuscript to be quite well-written and clear, statistical analyses appropriate and a reasonable interpretation and discussion of the results obtained. My most important comment would be that the authors should take the opportunity to discuss a bit further the causes for the low resolution of the ABC-RF approach to discriminate colonization routes in the context of this study. It looks to me that additional causes other than the low genetic differentiation (and high gene flow) can also contribute to this outcome such as the low marker density (considering current population genomics standards) and perhaps the high complexity (and number) of demographic models tested. I think this would be an important addition particularly considering that the ABC-RF is a recent approach. Furthermore, some more methodological information should be provided to facilitate interpretation of some of the results obtained (I detail this in my comments below).
Main comments: 1) Line 322 – No information is provided about the location of the SSR markers in the genome. Is this available? If so, this information should be included. If not, is it possible to assume that these markers represent a random sample of the genome (e.g. were the SSR markers obtained from different contigs)? 2) Line 675 – Comment: the Moroccan populations also seems an unlikely choice as potential colonizers considering its low diversity (apparently even lower than US populations looking at data from table 1). Is there any a priori knowledge to support this hypothesis? 3) Line 801 – It would be important to discuss differences in ABC-RF performance between this and other studies particularly given that this is still an emergent approach. For example, were the observed high prior rates obtained in other studies? And were the causes for this similar? Also, I think a brief reference to the possible impacts of changes in the genetic survey would be in order. e.g. would increased marker density allow for higher power to detect the different demographic scenarios (i.e. colonization routes)? And would other markers (such as SNPs) allow for more powerful inferences?
Other Comments: Line 240 – Correct to “lose”. Line 486 – Was there any criterium used to define the number of simulations chosen? Was it tested whether an increase in the number of simulations could reduce the prior error rates? Line 684 – There is no figure 3c, is this figure 2c (the STRUCTURE data)? Line 693 – Remove “of”. Line 899 – In addition to larger sampling effort, I would argue that future investigations would also benefit from an increased marker density to enhance the resolution power to discern colonization routes. Even more so, when dealing with scenarios of recent colonizing events (and likely complex demographic histories) with relatively low differentiation between the populations in study.
Fig 2e – What do the circles represent? This should be stated in the figure legend.
The authors address a couple of interesting questions in this paper: 1) the colonization history of rosy apple aphid out of its presumed origins in Central Asia, and 2) whether different species of endosymbionts are related to the colonization routes, perhaps through helping the spreading aphid species with local adaptation. The authors bring a number of sophisticated population genetic analysis tools to bear on these questions. They were hampered by the inability to obtain samples of the aphid from the presumed region of origin, but apparently not through lack of trying. In the end, the authors are unable to reconstruct the colonization routes, but did gain some interesting insights about gene flow and probable dispersal ability of the aphid. It is also interesting that very little diversity in endosymbionts was discovered across a great geographic range of sampling. I do not have any major concerns about the analyses or conclusions, but do have some minor suggestions I hope the authors will consider.
L78: change “releaved” to “revealed”
First paragraph of Intro: I suggest the authors briefly define what they mean by “crop parasite”. I think I intuitively have a sense of why aphids, for example, can be called a crop parasite. But what distinguishes them as a crop parasite rather than simply a specialized crop pest? Although I recognize I simply may be ignorant, I immediately stumbled over “crop parasite” used in this way; and when I searched the internet a little to educate myself, I found almost nothing related to this term. So I do not think it is common usage. I am not saying this is an incorrect usage, only that there may be others who will stumble over it like I am stumbling. Also, it is mentioned three times in the first paragraph, and never again in the rest of the paper, so it would probably be best to simply not use it.
L102: “migration” may not be the best word, because it can be confounded by true migratory behavior, which may or may not be characteristic of a particular species which is invading or expanding its range. Could the authors substitute “colonization routes”?
L108: delete “that use crops”
L152: suggest changing to “Aphids infest a wide range of host species, and can be major pests of many crop plants…”
L161-163: The way this is written, the sentence is saying that population studies using a combination of three different markers systems (SSR, sequence, and SNP) to reconstruct aphid colonization history are rare. Is this really what the authors mean? i.e., that they are interested in a study of aphid colonization history only if it uses all three types of markers? Why would a study have to use all three marker systems to be useful? If this the meaning they intend, why is using all three marker systems in this context superior?
L171: delete extra “)”
L173: change to “…structure, and the extent…”
L174: change “have taken place” to “occurred”
L176: change “interesting” to “useful” or “valuable”
L177: delete “indeed”
L178: delete “that are”
L181: change “aphid obligate” to “obligate aphid”
L183: change “typical other” to “other typical”; also, delete “for instance” (because it is redundant with “e.g.” )
L185: change “signal” to “signals”
L186: change “as a way to reconstruct” to “to help reconstruct”; also, delete “the study of the”
L187: change to “help in assessing”
L189: delete “the” in front of “variation”
L190: change “showing” to “revealing”; delete “also”
L194: delete extra "("
L196: suggest changing "migration" to "colonization" (?)
L203: North America? If the intent is to include South America, then change to "the Americas"
L207: Do sexual reproductive adults have wings? Do all generations have wings as adults? When is flight possible? What is known about dispersal behavior in this species?
L208: change "takes" to "taking"
L215: delete "ancestrally"
L222: change "is" to "are"; also, change "supports" to "support"
L222-224: change to "The colonization routes of rosy apple aphid are unknown, except that historical records document its introduction in America was very recent…"
L227: change "especially in" to "including"; also change "damages" to "damage"
L228: change "is" to "are" (the word "data" is plural); also, change "on" to "regarding"
L230: change to "Here, we investigate the colonization history…"
L231-232: change to "…genetic datasets drawn from comprehensive samples taken from cultivated apple, in Europe, North America, and Morocco.
L233-235: change to "we failed to collect D. plantaginea in its putative source region where apple trees originated in Central Asia, preventing us from fully addressing its earliest colonization history."
L236: change "the most damaged regions by" to "the regions most negatively affected by"
L240: change "loose" to "lose"
L246: was each location sampled in each year? Or only once, either in 2017 or 2018? In Supp Table S1, could date of sampling be added to the table?
L248-252: Was a single, different individual used for each of the methods? - i.e., 1 individual for SSR, a second individual for Sanger sequencing, and a third individual for 16S? Or was the same single individual used for all three methods?
L258: What constituted a control? An unwashed aphid? A negative control of no aphid?
L267: What is P. lanceolata? A plantain overwintering host?
L285: change "the aphid genus" to "aphid genera"
L308: change to "as the outgroup"
L343: delete "of"
L351: delete "the"
L424: change "choose" to "chose"
L440: change "algorithm" to "logarithm"
L566: change "representants" to "representatives"
L576: change "only kept" to "kept only"
L580-581, and L586: change "north-east" to "northeast"; and change "south-west" to "southwest"
L691: delete "this analysis infer"
L693: change to "lacked the power"
Delete lines 696-698. Not needed.
L706-708: Material in parentheses should be converted into a stand-alone sentence.
L713: change to "on P. communis in Iran"
L714: change "highlighted" to "highlight"
Fig 2 caption: Several problems with the caption and the figure itself as indicated below. L942: delete "with" L944-946: "…and, ii) a barplot including…" There are no bar plots in panels a., b., or c. L950-952: Most of these abbreviations are not found in any of the Fig. 2 panels, and some abbreviations in the panels (e.g., DA, MOR) are not in the caption. Panel d.: The Y-axis is labeled twice with different percentages (1.25% and 1.76%). Which is correct? Also, I assume one of these should be the label for the Z-axis. Panel e.: What is the meaning of the shaded circles around the Fst values (including different sizes and shading color)?
Fig S4, S5, S6: Abbreviation for United Kingdom is UK in caption, but GB on figure axis.
Fig. S6 caption: Delete last sentence "Samples are sorted…", because this is already stated earlier in caption.
Table 1. Only one entry in the Sp column is marked as "n.s.". Does this mean all the other entries are significant? Usually significant values are marked with an asterisk or other superscript (as is done for Fis in this table), and non-significant values are left unmarked. So this Sp column and the values in the last two columns of the table being marked as n.s. or left unmarked is disorienting and unconventional, and should be changed. Referring in the caption to left and right sections of the table is also unconventional and non-intuitive. Either indicate the boundary of left and right sections with a bold line or some other visual method, or (preferably) split this into two different tables.
There is a Fig. S13 and Fig. S15, but no Fig. S14.
Fig. S15 caption: delete "according to the legend on the bottom legend"
L717-726: This is a good summary of the findings, but should be integrated into the Conclusions at the end of the paper, not at the beginning of the Discussion.
L737: change "but" to "and"
L777-779: Inferring probable multiple introductions into the USA since 1890 may be too speculative. An initial introduction event followed by 1 sexual generation per year since then in both the US and Europe would seem enough to maintain mutual clustering. And it is consistent with the low genetic diversity in US populations, because diversity should increase with every additional introduction. The authors may be right, but could they discuss the evidence supporting their inference of multiple introductions?
L790-791: What do the authors mean by a "relaxed" founder event?
L820: change to "The observed subtle spatial…"
L822: Change "nowadays and, probably" to "nowadays, and probably"
L823: change to "in the form"
L827-830: The logic in this sentence is not clear. Why are the authors talking about cider production leading to more intense intra-Asturias apple-material exchange (more intense than what?), and then jump to including intra-region exchange being intense in the rest of Europe also?
L830-832: It would seem that, at least for America, the most parsimonious explanation for high differentiation from Europe would be the Atlantic Ocean, which is indeed a formidable physical barrier.
L840: delete "yet"
L841: change to "also have originated"
L843: change "fail" to "failure"
L847-848: change "also casts doubt as to whether D. plantaginea is common in this area" to "suggests D. plantaginea is uncommon in this area"
L854: "…Dysaphis reaumuri Mordvilko and Dysaphis pyri Boyer de Fonscolombe is Pyrus L." Something is grammatically wrong with this part of the sentence, and I cannot determine the intended meaning.
L890: "…suggest that such a spread of resistant genotypes may be contained." Although there is significant differentiation between intra-European populations, that does not mean there is no gene flow between them. The pairwise Fst's, while significant, are quite low, so I am not sure resistance evolving in Europe somewhere would be slowed much from spreading throughout the rest of Europe.
L898: Not sure what the authors mean exactly or why they say this. Elsewhere, they indicate this is where apple was domesticated (L842). L234 also suggests this.
