
Purifying selection on highly expressed genes in Penguins
Gene expression is the main driver of purifying selection in large penguin populations
Abstract
Recommendation: posted 26 March 2024, validated 28 March 2024
Rannala, B. (2024) Purifying selection on highly expressed genes in Penguins. Peer Community in Evolutionary Biology, 100705. 10.24072/pci.evolbiol.100705
Recommendation
Given the general importance of protein expression levels, in cells it is widely accepted that gene expression levels are often a target of natural selection and that most mutations affecting gene expression levels are therefore likely to be deleterious [1]. However, it is perhaps less obvious that the strength of selection on the regulated genes themselves may be influenced by their expression levels. This might be due to harmful effects of misfolded proteins, for example, when higher protein concentrations exist in cells [2]. Recent studies have suggested that highly expressed genes accumulate fewer deleterious mutations; thus a positive relationship appears to exist between gene expression levels and the relative strength of purifying selection [3].
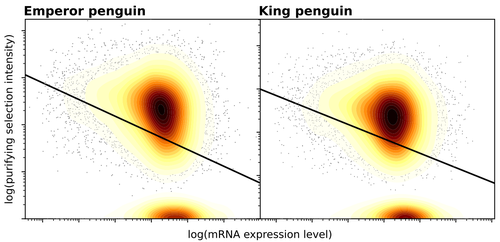
The recommended paper by Trucchi et al. [4] examines the relationship between gene expression, purifying selection and a third variable -- effective population size -- in populations of two species of penguin with different population sizes, the Emperor penguin (Aptenodytes forsteri) and the King penguin (A. patagonicus). Using transcriptomic data and computer simulations modeling selection, they examine patterns of nonsynonymous and synonymous segregating polymorphisms (p) across genes in the two populations, concluding that even in relatively small populations purifying selection has an important effect in eliminating deleterious mutations.
References
1] Gilad Y, Oshlack A, and Rifkin SA. 2006. Natural selection on gene expression. Trends in Genetics 22: 456-461. https://doi.org/10.1016/j.tig.2006.06.002
[2] Yang JR, Liao BY, Zhuang SM, and Zhang J. 2012. Protein misinteraction avoidance causes highly expressed proteins to evolve slowly. Proceedings of the National Academy of Sciences 109: E831-E840. https://doi.org/10.1073/pnas.1117408109
[3] Duret L, and Mouchiroud D (2000). Determinants of substitution rates in mammalian genes: expression pattern affects selection intensity but not mutation rate. Molecular Biology and Evolution 17; 68-070. https://doi.org/10.1093/oxfordjournals.molbev.a026239
[4] Trucchi E, Massa P, Giannelli F, Latrille T, Fernandes FAN, Ancona L, Stenseth NC, Obiol JF, Paris J, Bertorelle G, and Le Bohec, C. 2023. Gene expression is the main driver of purifying selection in large penguin populations. bioRxiv 2023.08.08.552445, ver. 2 peer-reviewed and recommended by Peer Community in Evolutionary Biology. https://doi.org/10.1101/2023.08.08.552445
The recommender in charge of the evaluation of the article and the reviewers declared that they have no conflict of interest (as defined in the code of conduct of PCI) with the authors or with the content of the article. The authors declared that they comply with the PCI rule of having no financial conflicts of interest in relation to the content of the article.
This study was supported by: PNRA_16 00164 (Programma Nazionale di Ricerca in Antartide". 2016. PI: Emiliano Trucchi); Institut Polaire Français Paul-Emile Victor (IPEV) within the framework of the Program 137-ANTAVIA (PI: Celine Le Bohec), by the Centre Scientifique de Monaco with additional support from the LIA-647 and RTPI-NUTRESS (CSM/CNRS-UNISTRA), by the Centre National de la Recherche Scientifique (CNRS) through the Programme Zone Atelier de Recherches sur l’Environnement Antarctique et Subantarctique (ZATA).
Evaluation round #1
DOI or URL of the preprint: https://doi.org/10.1101/2023.08.08.552445
Version of the preprint: 1
Author's Reply, 12 Mar 2024
Decision by Bruce Rannala, posted 03 Oct 2023, validated 03 Oct 2023
This is an interesting, well-written paper examining the relationship between gene expression levels and the strength of purifying selection (as measured by pN/pS) in two species of penguin. Some compelling patterns emerge suggesting that increased gene expression levels at a locus are associated with increased selection.
I have read the paper and the comments/concerns of the two referees and largely agree with their comments and suggestions for changes. However, I will leave it up to the authors whether they wish to follow reviewer Pyhäjärvi's suggestion to reorganize the materials and methods incorporating more content from the extended methods section.
An additional concern I had that was not specifically mentioned by either reviewer is that the idea of deciding between population size versus gene expression as the "main driver" of purifying selection appears logically flawed. As the authors know, the strength of purifying selection should be proportional to Ns. Gene expression alters the phenotype and therefore changes s. With larger N (if one believes the classical theory) the expectation is that a change of s will have a proportionally larger effect, this does not mean that s is the main driver of selection. Trying to partition the effects of N and s only seems to make sense if their effects are additive, but they are in fact multiplicative.
There is also the issue that the population size differences are unknown with only the ranked population sizes extrapolated from differences of diversity, Tajima's D, etc. Since the locus specific mutation rates for non-coding DNA should be similar between species why not estimate theta for each species and compare them to determine the proportional difference of effective population size? Does it make sense to try to examine the effect of differences of population size for the pengiun species when only two species/populations are available and only the possible rank order of size difference is known?
One of the reviewers also noted in reference to the simulation study of population size versus selection that it is difficult to evaluate the "larger effect" of gene expression versus population size because "the two variables are compared on different scales". I agree. In any case, my opinion is that the comparisons of population size versus gene expression could be omitted entirely and the paper would be improved. The other results stand on their own and support the authors' arguments for considering gene expression levels when evaluating selection in populations of interest to conservation biologists, etc.
Please respond to all the reviewers' comments if you choose to revise your paper for reconsideration.
Reviewed by Tanja Pyhäjärvi, 07 Sep 2023
Trucchi et al combine genetic polymorphism data and gene expression data of two penguin species (King and Emperor) to examine the effects of gene expression level and effective population size (Ne) on the level of purifying selection.
The manuscript seeks to demonstrate the relationship between gene expression level and purifying selection in two species with different Ne. However, the method used to infer the effect of purifying selection, the ratio of synonymous vs. nonsynonymous segregating sites, is the weak link of the work. The data could be used to actually estimate piN/piS, a more widely used and less biased measure of the extent of purifying selection. Since this is a very essential estimate for the conclusions, it would be important to obtain as unbiased measure as possible.
In addition, to state that gene expression has larger effect than effective population size is an overstatement, given that only two very closely related species have been studied here. Wouldn’t a more fair comparison be to compare the effect of gene expression level across all genes to the effect of Ne variation across all possible Ne:s? It is also very essential in the text to clearly separate the distribution of s, or its shape from the distribution of Ne*s. The gene expression level and its distribution could act as a proxy to the former, but not the latter as it, by definition, ignores the differences in Ne.
In several places it is stated that evolutionary rate and gene expression anticorrelation has not been estimated in natural populations. It would be fair to cite and summarize findings of e.g., Slotte et al. (2009, global sample of Arabidopsis accessions, https://doi.org/10.1093/gbe/evr094), Josephs et al. (2017, Capsella grandiflora sample from a natural population https://doi.org/10.1093/gbe/evx068) or Galtier et al. 2016 (2016, 44 non-model animal species https://doi.org/10.1371/journal.pgen.1005774) just to name some that have observed the relationship. If the authors were referring to gene expression, not the polymorphism data from natural population, this should be clarified as they inform about very different phenomena (e.g., protein misfolding in laboratory vs. natural selection in laboratory populations).
This may be unnecessary for pre-prints, but I would personally prefer the methods to be part of the main manuscript text, not as a separate section. Also, the extent of materials and methods seems very lengthy in comparison to the other parts of the preprint. Several key concepts, hypotheses and conclusions are in the extended methods section. The preprint could be improved by bringing some of that content to the main text and making the style of writing and presentation more coherent.
Detailed commetns:
Line 50: And/or because highly and widely expressed genes have conserved essential functions?
L. 52-57 this statement is not completely fair description of the current literature.
L. 61: Of course not, because the effect depends on the joint effect of Ne and s. If the idea is that the relationship is something that is not linear, please clarify.
L. 67-68: This statement needs to be more specific. Effect in what sense? At what range of Ne variation?
Figure 1 B. Please check the color scheme. It is not clear how to separate E vs. K from non-synonymous to synonymous polymorphism and divergence.
Figure 2C: Counts of segregating sites are prone to bias in mappable genome. Pi estimates would be better for comparative purpose as they take account differences in the amount of monomorphic synonymous and nonsynonymous sites as in the sample size.
Figure 3 would be much easier to evaluate if it would not be log10 transformed and if it would be presented as a histogram of allele frequencies in all frequency classes (allele frequency spectrum). In the current version, it remains puzzling e.g., how nonsynonymous spectrum > CPM 0.3 is consistently smaller than the synonymous, across all frequency classes. When obtaining the AFS from NGS data, it is critical to explain how missing data was handled as it results in variation in maximum derived allele count among sites. This aspect is critical for the main conclusions of the paper and thus needs to be explained in detail.
Figure 4, Are the ratios not calculated per synonymous sites or nonsynonymous sites? Are these ratios only based on counts of segregating sites? I strongly recommend using piN/piS instead of just counts of segregating sites, where there are more clear expectations and earlier empirical evidence to compare your results to.
L. 326 Minimum depth of 3 reads per individual seems very low. It is quite easy to miscall heterozygotes and homozygotes with three reads. I suggest using much higher depth threshold at genotype level.
L. 332 vcf files should be available in a repository.
L. 342 Ancestral is not equal to reference and derived not equal to alt allele. The whole section 1.4 should be written as a scientific text and not as a list that is somewhat hard to interpret. Clearly explain here what was done. This is an essential part of the analysis and needs to be clearer.
L. 336 Why were the King and Emperor allele counts summed up?
Section 1.5 contains important details of polarizing the SNPs in interpreting the data. Part of the text belongs to the main text results and discussion. As a whole, this section would benefit from an introductory paragraph explaining why this procedure is necessary and it could be combined with section 1.4 There are vague references to population genetic theory, but the exact predictions should be stated, and relevant literature cited. Sex chromosomes and HWE are passingly mentioned but not really put into context.
Supplementary figure 3: see comments on Figure 3
1.6. How does the vcftools handle missing data when estimating pi? It may assume that all missing sites are invariant. See for example Korunes and Samuk 2021 for possible pi estimate biases of vcftools (https://doi.org/10.1111/1755-0998.13326).
L.466-471 and throughout the manuscript: GitHub or other repository may be a better place to share the exact code that was used to produce the data.
L477-478 Please justify, why counts of synonymous and missense polymorphic sites are used, rather than pi (the mean pairwise differences per bp). Further, more appropriate than normalizing by the CDS length would be to calculate the amount of total synonymous sites (or 4-fold sites, which is more straightforward) and use that as a nominator to obtain per bp estimates of nucleotide diversity in different SNP categories. Further, these estimates must be adjusted according to the same or similar filtering criteria that were used for SNPs. Just normalizing by CDS length does not consider that not all nucleotides of the CDS are part of your data and that unequal proportion of them are synonymous and missense.
L486: these hypotheses would better fit to the main text of the preprint.
L. 495-497 “difference will be the same” need more explanation. Difference measured how? Please tie this to the prediction that the effect of selection depends on the product of Ne and s. Please provide the equations to clarify the prediction. Do you suggest that Ne does not have an effect at all?
Reviewed by anonymous reviewer 1, 06 Sep 2023
Note that this review was jointly performed by two people.
This manuscript investigates the correlation between gene expression and measures of purifying selection, primarily pN/pS, in two separate penguin populations, along with investigating the effect of increases in purifying selection vs increases in population size on pN/pS. These are both interesting questions to investigate and have clear importance for questions regarding protein evolution. The use of wild transcriptome data to investigate the polymorphism vs expression relationship is notable. The main claim of the study is that gene expression is a stronger driver of purifying selection than population size in this system.. The manuscript also argues that gene expression levels can approximate the distribution of fitness effects in non-model species. We found that this work is overall interesting, but have a few concerns about the statistical analyses, population genetics mechanisms, and claims about the novelty of the study, that we discuss below.
Major comments:
1. We are concerned about the choice to use binned data to estimate the difference of nonsynonymous and synonymous polymorphisms across expression levels (Fig 2 and the results section titled “Purifying selection more efficiently removes nonsynonymous segregating variants in genes while expression rate increases”). Since these two variables are naturally continuous, it is more appropriate to analyze them as scatterplots instead of arbitrarily binning them, potentially inflating the statistical signal. We suggest re-plotting figure 2 as a scatterplot. There may be outliers along the expression dimension, which could be why the authors binned their expression values into percentiles, but they could also look at the logarithm of expression to alleviate this problem while keeping the variable continuous. The authors would then calculate a spearman’s correlation between pN/pS and log(gene expression + 1)
2. The authors show in Figure 1 that they have dN/dS measurements for each species, but they only focus on pN/pS. We were curious whether the dN/dS results recapitulate the same trends as pN/pS, seeing as how the two species don’t seem to differ drastically in dN/dS. Some additional explanation on why only pN/pS results are presented would be appreciated, since dN/dS also quantifies purifying selection. In addition, having dN/dS results displayed more prominently would make this study easier to compare to the many previous studies that have looked at the relationship between expression and dN/dS.
3. One of the study’s main claims is that gene expression has a larger effect on purifying selection than changes in population size. However, it is hard to evaluate this claim because these two variables are compared on different scales with different units and different scopes. For example, is a change in height by 5 inches comparable to a change in weight by 5 pounds? Similarly, is a decrease in selection coefficient from -0.1 to -0.01 comparable to a population size change from 100,000 to 10,000? To compare the effects of the two different variables, it would be helpful to standardize them according to their respective mean and variance. We realize this might not be possible for the natural data, but it could be helpful for the simulated data. Alternatively, it could be helpful to look at population scaled selection coefficients (2*Ne*s for diploids) instead to demonstrate this claim more clearly.
4. While it is clear that gene expression is highly correlated with measures of purifying selection, and thus could be used as a proxy for purifying selection, we are not sure if gene expression could approximate the entire distribution of fitness effects based on the data presented here. A DFE includes information about both the mean and variance of mutation effects. We can see how gene expression could provide information about the mean of the DFE (higher average expression, lower average selection coefficient), but we are not clear how it provides information about the variance. Unless perhaps the mean and variance are correlated or linked somehow? We would appreciate either some clarification on this point or rewording of the claim.
5. The authors collected gene expression data across multiple tissues, so we assume that the gene expression levels in their plots show expression averaged across all sampled tissues. We couldn’t find this detail stated explicitly though, so we would appreciate some clarification on this. In addition, we don’t want to require additional analyses but wanted to suggest for here or future work investigating how tissue-specificity of expression also relates to purifying selection, since the authors may have that data already? Tissue-specificity is typically highly correlated with average expression levels (For example, see Slotte et al 2011: https://doi.org/10.1093/gbe/evr094) and Duret and Monod 2000 is cited in the introduction which was one of the earlier papers to demonstrate the importance of tissue-specific expression on evolutionary rates.
6. This study includes two different penguin species, Aptenodytes patagonicus and Aptenodytes forsteri, and genotypes were identified by aligning reads in both species to the same reference genome (Aptenodytes forsteri) (Extended methods section 1.3). Presumably, reads from A. forsteri will align at a higher rate and lead to more genotype calls compared to A. patagonicus. Is it possible that this reference bias could explain some of the results of this study?
7. This manuscript emphasizes that it is the first to investigate selection on genes of different expression levels in natural populations. However, there are many studies that use genotypes from natural populations with expression from lab-reared individuals to address the relationship between gene expression and selection. For example see.
Carneiro et al. 2012: https://doi.org/10.1093/molbev/mss025
Williamson et al 2014 https://doi.org/10.1371/journal.pgen.1004622
Hodgins et al. 2016 https://doi.org/10.1093/molbev/msw032
If the authors mean to imply that the novelty of this study comes from using wild-collected transcriptome data, it would be useful to know how their transcriptome data compares (and differs) from expression data from captive or lab-reared individuals or about their expectations for why transcriptomes from wild-caught individuals will differ from those of lab-reared individuals..
Minor comments:
Supplemental section 1.3: Annotated variant files are said to be available upon request. It would be nice if these were deposited somewhere once the manuscript is accepted for publication.
Supplementary methods section 5: The definition of genetic load here includes the phrase “cost paid”. We think it would help the reader to break down this phrase a little more and mention the accumulation of deleterious mutations that decrease the fitness of “high load” individuals relative to individuals with fewer such mutations.
Download the review


