
Are both very young and the very old plant lineages at heightened risk of extinction?
Range size dynamics can explain why evolutionarily age and diversification rate correlate with contemporary extinction risk in plants
Abstract
Recommendation: posted 29 September 2018, validated 03 October 2018
Mooers, A. (2018) Are both very young and the very old plant lineages at heightened risk of extinction?. Peer Community in Evolutionary Biology, 100058. https://doi.org/10.24072/pci.evolbiol.100058
Recommendation
Human economic activity is responsible for the vast majority of ongoing extinction, but that does not mean lineages are being affected willy-nilly. For amphibians [1] and South African flowering plants [2], young species have a somewhat higher than expected chance of being threatened with extinction. In contrast, older Australian marsupial lineages seem to be more at risk [3]. Both of the former studies suggested that situations leading to peripheral isolation might simultaneously increase ongoing speciation and current threat via small geographic range, while the authors of the latter study suggested that older species might have evolved increasingly narrow niches. Here, Andrew Tanentzap and colleagues [4] dig deeper into the putative links between species age, niche breadth and threat status. Across 500-some plant genera worldwide, they find that, indeed, ""younger"" species (i.e. from younger and faster-diversifying genera) were more likely to be listed as imperiled by the IUCN, consistent with patterns for amphibians and African plants. Given this, results from their finer-level analyses of conifers are initially bemusing: here, ""older"" (i.e., on longer terminal branches) species were at higher risk. This would make conifers more like Australian marsupials, with the rest of the plants being more like amphibians. However, here where the data were more finely grained, the authors detected a second interesting pattern: using an intriguing matched-pair design, they detect a signal of conifer species niches seemingly shrinking as a function of age. The authors interpret this as consistent with increasing specialization, or loss of ancestral warm wet habitat, over paleontological time. It is true that conifers in general are older than plants more generally, with some species on branches that extend back many 10s of millions of years, and so a general loss of suitable habitat makes some sense. If so, both the pattern for all plants (small initial ranges heightening extinction) and the pattern for conifers (eventual increasing specialization or habitat contraction heightening extinction) could occur, each on a different time scale. As a coda, the authors detected no effect of age on threat status in palms; however, this may be both because palms have already lost species to climate-change induced extinction, and because they are thought to speciate more via long-distance dispersal and adaptive divergence then via peripheral isolation.
Given how quickly ranges can change, how hard it is to measure niche breadth, and the qualitatively different time scales governing past diversification and present-day extinction drivers, this is surely not the last word on the subject, even for plants. However, even the hint of a link between drivers of extinction in the Anthropocene and drivers of diversification through the ages is intellectually exciting and, perhaps, even, somehow, of practical importance.
References
[1] Greenberg, D. A., & Mooers, A. Ø. (2017). Linking speciation to extinction: Diversification raises contemporary extinction risk in amphibians. Evolution Letters, 1, 40–48. doi: 10.1002/evl3.4
[2] Davies, T. J., Smith, G. F., Bellstedt, D. U., Boatwright, J. S., Bytebier, B., Cowling, R. M., Forest, F., et al. (2011). Extinction risk and diversification are linked in a plant biodiversity hotspot. PLoS Biology, 9:e1000620. doi: 10.1371/journal.pbio.1000620
[3] Johnson, C. N., Delean S., & Balmford, A. (2002). Phylogeny and the selectivity of extinction in Australian marsupials. Animal Conservation, 5, 135–142. doi: 10.1017/S1367943002002196
[4] Tanentzap, A. J., Igea, J., Johnston, M. G., & Larcombe, M. G. (2018). Range size dynamics can explain why evolutionarily age and diversification rate correlate with contemporary extinction risk in plants. bioRxiv, 152215, ver. 5 peer-reviewed and recommended by PCI Evol Biol. doi: 10.1101/152215

The recommender in charge of the evaluation of the article and the reviewers declared that they have no conflict of interest (as defined in the code of conduct of PCI) with the authors or with the content of the article. The authors declared that they comply with the PCI rule of having no financial conflicts of interest in relation to the content of the article.
Evaluation round #2
DOI or URL of the preprint: 10.1101/152215
Version of the preprint: 3
Author's Reply, 20 Sep 2018
Decision by Arne Mooers, posted 20 Sep 2018
AE report on Tanentzap et al. v2
The revised version of this interesting study connecting past diversification and present-day extinction risk offers contrasting patterns at two taxonomic levels, and tying the two patterns together is proving a bit difficult, at least for me.
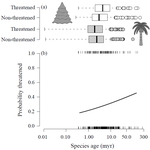
The initial, taxonomic large-scale pattern – and what originally set the paper apart as potentially of note – is the following: across a large set of vascular plant genera, there is a consistent, if not strong, correlation between average diversification rate (or younger genus stem age) and the probability of being globally threatened (Figure 1a). This is consistent with patterns in Amphibians (Greenberg and Mooers) and plants (Schwartz and Simberloff and Davies et al.), and there are interesting mechanistic connections via ongoing and rapid peripatric speciation leading to small geographic ranges in young species.
However, after reviewing their data, the authors now report a (backwards from the previous version and) contrasting pattern for conifers – here species on longer terminal branches are more likely to be listed as globally threatened (Fig. 2). Conifers are an "old" taxon, associated with a warmer, wetter earth, and it is certainly possible that what drove their diversification and what drives their current global status might be different from vascular plants more generally.
The authors decide to compare the "potential" range size of pairs and threatened (TH) vs. non-threatened (nonTH) species, and lay out a particular scenario consistent with the results across plant genera (lines 188+): "For example, there may be greater disparity in the ranges of young species pairs under peripatric as opposed to allopatric speciation (Gaston 1998; Hodge and Bellwood 2015), resulting in a negative correlation between age and range disparity." This, to my mind, implies that younger species are both more likely to be at risk, and that, as time passes, and sister-species range sizes become more equal as the peripatric budding species increases its range, and the "younger" species of the pair becomes non-threatened. However, the first part of the scenario is not supported by the initial conifer data, so it is hard to gauge what to do with this model; confusingly, the difference in potential range between nonTH and TH sister species does seem to decrease with time (Fig. 3). So, if we combine the results from Fig. 2 and Fig. 3 together, we have younger nonTH-nonTH pairs and older nonTH-TH and TH-TH pairs (assuming there are some of this third class).
The authors interpret the Fig 3 pattern (expected from line 188 under peripatric speciation) as follows: because TH species will have small ranges by definition, the equalizing of ranges with age is consistent with the nonTH species in nonTH-TH pairs losing range via specialization or loss of habitat over paleontological time.
I leave aside the issues surrounding "potential" vs. "realized" range size, as this is clearly articulated by the second reviewer below. My concern is with the interpretation of the range-size disparity vs. age plot.
My own initial (but perhaps faulty) interpretation of the pattern was that the non-TH vs. TH sister pairs were the appropriate controls for overall "niche breadth." Thinking out loud, it may be that nonTH-TH pairs arise (in any geographic context) in a context that is now deteriorating, the TH species is currently simply the more unlucky member, while the sister species is also shrinking (and so might eventually become TH). In contrast, nonTH-nonTH pairs (the "controls") are pairs that arose in (large) stable niche space; these two ideas together would support Fig. 3. However, this links threatened status to niche contraction fairly indirectly by specifying a scenario where both members of the nonTH-TH contrast represent adaptation on a shrinking niche space. And, if shrinking niches were also older than stable ones, then we could get Fig. 2. Unfortunately there is no overall negative relationship between potential range size and lineage age (Table B1), implying that older conifer species generally are not losing out in this way. (Perhaps a more focused test of this scenario would be to compare the average potential range size of the nonTH species in nonTH-TH pairs with the average of nonTH-nonTH pairs. I don't know, though.)
Of course, this may not be the scenario the authors have in mind, but whatever model needs be made clearer, and then challenged with the data. Both I and the other reviewer are uncomfortable using TH species as controls here, at least without more justification.
One additional thought: As I read through the paper once again, I keep getting caught up at line 115. Given that stem ages are being used to estimate age and diversification rates, why do you drop monotypic species – surely these are "low diversifiers" par excellence?
Arne Mooers
Report from Dan Greenberg
The revised version of Tanentzap et al. “Range size dynamics can explain why evolutionarily age and diversification rate correlate with contemporary extinction risk in plants” addresses several issues raised in the previous review, but now raises several additional issues and outstanding questions with their updated analysis.
The revised introduction is a major improvement, as it sets up a clear rationale for the various ways in which speciation events, time since speciation, range size and extinction risk could be expected to interact under various hypotheses. My interpretation of the crux of their argument is that evolutionary ‘age’ can relate to extinction risk in two potential ways:
1. That recently diverged species are at a higher risk of extinction due to:
a. Smaller geographic ranges due to recent speciation
b. Less of their potential range being filled
c. Potentially higher specialization/lower generalism compared to more ancestrally diverged species
2. That species which diverged earlier are at a higher risk of extinction due to:
a. A declining environmental niche space, and
b. Increasing specialization through time
The authors seem to find contrasting support for these hypotheses at different scopes: hypothesis 1 is supported as rapidly diversifying plant genera have a higher proportion of threatened species, but hypothesis 2 is supported within a species-level analysis of the conifers, with no clear relationships among palm species. Though some predictions of these hypotheses are indeed tested, I find the overall message of the manuscript to be confusing due to 1) contrasting patterns at different taxonomic levels without a clear explanation of why these would/should differ, and 2) a lack of realized range data to test the key predictions that range size either declines or increases with divergence time across species, and 3) the fact that it’s unclear what the potential range size metric actually represents, presumably some measure of fundamental niche breadth, but without realized range data it’s hard to grasp what is going on here.
With respect to 1):
The authors explain the contrasting age-risk patterns in conifers vs plants generally due to differences in speciation mode: conifers being highly vicariant rather than the more dispersal-driven palms going forth and colonizing new adaptive landscapes. However, a mode of speciation that relies on budding would expect the opposite relationship in my mind: lots of vicariance should result in higher risk in younger species that are range-restricted (as they are recently budded). Indeed, this is the mechanism Davies et al. 2011 invokes for the Cape Flora, and perhaps if anything we'd expect most plant lineages to follow this vicariance driven model (supporting the broader observation among plant genera). Is the difference in age-risk relationships due to a difference between peripatric vs. other forms of allopatric speciation? Are conifers unique or are they closer to the common rule amongst the other plant clades?
With respect to 2):
I think the authors need some measure of realized range size in here to make this all logical. Simply it’s not clear how divergence time and range size relate in palms vs. conifers, but this is key to our understanding of the range-risk-age relationship. The potential range size metric doesn’t seem to address the key predictions of the hypothesis, and it's hard to interpret as a “potential” metric (especially as a ratio between NT:T species, see below). Reviewing their previous version with the range filling metric I actually preferred this to the new “potential range size” metric, although I agree that the number of occupied cells is likely far underestimating the actual range size of these species. I'm not sure what the solution is here since I'm not familiar with plant biodiversity data - are there IUCN polygons for species or can they build a minimum convex polygon between GBIF points to estimate realized range size?
With respect to 3):
The authors then use an analysis of range potential to help explain this pattern. However, I'm not entirely sure why they had the NT:T species pairing as these are contemporary human distinctions, although they may reflect biological attributes as well. As well, it's not clear that there should be a difference in range potential changing over divergence time for threatened vs non-threatened groups. Similarly, is there a relationship between potential range size and threat status? Presumably a small potential range size indicates a high degree of specialization and subsequent extinction risk – it would be interesting to specifically test this.
I think the manuscript could be made much clearer if an estimate of current range size were added, and potentially contrasted with the potential range size metric, to specifically test several predictions of the hypotheses that were presented. It seems critical to know: whether recently diverged species have smaller range sizes on average, whether recently diverged species have filled more of their potential range size, and whether evolutionary range size patterns differ within palms and conifers.
Though the ideas and concepts presented in this manuscript are very compelling, I think there’s further digging into the data that will be required to fully understand how range dynamics contribute to patterns of extinction risk in the plant tree of life.
Evaluation round #1
DOI or URL of the preprint: 10.1101/152215
Version of the preprint: 2
Author's Reply, 28 Aug 2018
Decision by Arne Mooers, posted 28 Aug 2018
The authors are interested in relating several macroevolutionary quantities of angiosperms -- stem age of a genus, diversification rate of a genus, and (for palms and conifers) the pendant edge length (or "age") of a species -- with the probability of being listed by the IUCN. As potential moderators of possible relationships, they measure (for palms and conifers) both the number of cells with GBIF records as a measure of range size and the difference between this number and the number of climatically suitable cells as a measure of range "filling." There are several motivations: patterns might offer possible mechanisms for (or even predictors of) extinction risk in plants, perhaps via a very old hypothesis linking the age of a lineage and its total range size. As the authors state, there are few known predictors of whether a particular plant species is imperiled, though Vamosi and Wilson did find that species in smaller families (especially monotypic families) were more likely to be at risk of extinction, while Davies et al. found that younger species of plants in the Fynbos of South Africa were more likely to be at risk of extinction, perhaps due to the small ranges associated with recent peripatric speciation in this group.
As pointed out by reviewer 2, the framework of the study might need a bit more work. Older species may indeed be more generalist for various reasons (sampling, past adaptation), and so be buffered against certain threats. Older species may also have larger ranges, or may occupy a larger fraction of available range as a function of time to disperse, though this latter idea would need some justification on the large temporal and geographic scales considered here. And (or maybe but) generalist plant species may also have larger ranges as a function of their generalist lifestyle. And, of course, threatened species have smaller ranges almost by definition. This means that picking these four measures (age, generalism, range size and range filling) apart as predictors of threat may be tough.
Consistent with some previous work, the authors do find evidence (r=0.15) that faster-diversifying genera indeed have a higher proportion of IUCN-listed species. The relationship with genus age was consistent, with younger genera also having a higher proportion of species at risk, though weaker (the authors state "no relationship", but the difference in the r-value of the fit of the two predictors is only 0.02 – I would definitely remove this from the abstract). Unfortunately, small sample sizes made the test of this relationship within the conifers and palms inconclusive, though no formal power analysis is offered.
On the bright side, consistent with these patterns, threatened conifer species are also younger on average than non-threatened species, though in palms, threatened and non-threatened species are indistinguishable in age.
All these are interesting patterns that deserve consideration, and the fact that palms and conifers differ is intriguing. In a final set of experiments, though, the authors consider whether total range size or their measure of range filling can help explain the conifer pattern. They contrast threatened vs. non-threatened sister species of conifer, and look at the difference in range attributes as a function of the age of the contrast. Just looking at the plots, it seems that older pairs of threatened vs. non-threatened species differ more in the proportion of their range that is filled, but less in the size of their ranges, with equal explanatory power (again, abs(r) ~ 0.15). The authors report that the null model, which considers pairs of species that do not differ in risk status, returns an expected r of -0.12 for both these contrasts vs. age. In the null model, the threat status is the same, such that there is no directionality to the contrasts, and so this negative relationship with age is based on the absolute difference in these quantities. It might also make sense that young pairs of species could differ more in range size or range filling than older pairs of species, e.g. under a simple peripatric model of speciation. The observed data are, of course, signed (NT-T, though it seems that the NT species always has the larger range, and more of its range filled because all y-axis values are positive on both plots. While I believe the first range-size pattern, the second range-filling pattern is itself perplexing.) Generally, I am not quite sure how the unsigned null model is to be used to interpret the signed real data. The second reviewer and I found this difficult to interpret, and so I suggest the methods here need to be clarified a bit more.
More generally, tests based on contrasts are often preferable (since they control so well for many other aspects of biology), but this approach does require more justification in this instance because contrast tests are designed to control for age, and age is a specific part of the model here – reviewer 2 raises the same issue. There would seem to be other, more straightforward things to test in order to get a better understanding of what is going on: we know from these data that threatened species have smaller ranges, but do younger species of conifers also have smaller ranges (or perhaps less filled ranges, which might be a proxy for long-term dispersal)? If so, might phylogenetic path analysis be useful - e.g. compare the model [age -> positive range attributes -> decreased risk] with the simpler direct models that have [age-> decreased risk] or [positive range attributes -> decreased risk]? If, however, age does not predict range attributes across conifers, then this more focused contrast-based test might be the way to go, if explained more clearly.
All that aside, it is still not clear to me how the main observation - that the difference in range filling between non-threatened and threatened species increases with age - should be best interpreted. One possibility is that non-threatened species fill their range faster than threatened species (e.g. due to dispersal). Under the peripatric model of speciation (which I invoked to explain the null model negative correlations), the smaller-ranged budded species is also the one with the less filled range at the outset, and time should make sister species more similar for both measures. But under this model, the larger-ranged species is ancestral, and so should be closer to its equilibrium range filling, and it should be the small-ranged species that starts filling suitable habitat. Because threat is something relatively new, the pattern might imply that species that cannot fill their suitable climatic range (perhaps due to biotic interactions or "specialism"), and actually fill it less and less through time are more likely to become threatened. Is this what you are invoking? Likely not, because range expansion and contraction is evoked for conifer speciation. But such a model does not make strong predictions about the difference in range size or range filling in young vs. old pairs of species, does it? (It might predict that older species have larger or more filled ranges, but that is not what is presented). A very clear verbal model that links time since speciation, speciation mode, and range filling would help me. Overall, while I like much of the data and the patterns, I am not yet sure of the mechanistic explanations proposed in this paper.
Both reviewers highlight some technical issues concerning GLMs and proportion data, and reviewer 2 asks for evidence that the measure of range filling is reliable. It is interesting that point data like GBIF are usually used as input to produce SDMs, not to compare with SDMs to get a measure of range filling. I am not expert in this area, especially for mechanistic SDMs, and so cannot comment further, but do wonder if there is a way to support the reliability of this measure, especially given how haphazard GBIF data are. The idea of environmental "mismatch" as a mechanism for a positive age-risk connection likely needs some extra justification as well: both reviewers picked up on this. Cycads and long-term global cooling might be a better example than ice ages and rhinoceroses (if narrower available niche space is indeed a driver of cycad decline). I add this at the end because, of course, you do not find any such relationship, and so perhaps you do not have to set it up at all.
Overall, I recommend that the paper needs a fair amount of revision before it could be considered for recommendation by PCI. I understand this is the second version of this paper, so I do not know if this fits in the authors' plans.
Arne Mooers
PS: Additional remark by the Managing board.
-Details of the quantitative analyses (e.g. data treatment and statistical scripts in R, bioinformatic pipeline scripts, etc.) in the recommended preprints must be available to readers in the text or as appendices or supplementary materials, for example.
Reviewed by Dan Greenberg, 01 Feb 2018
Reviewed by anonymous reviewer 1, 10 Apr 2018
Major Points
There is much to like about this analysis, which explores the relationship between diversification, range size and extinction risk across vascular plants. However, limits to the available data and some rather weak conceptual links somewhat detract from the paper overall.
Previous work has demonstrated that, at least in some clades, more rapidly diversifying lineages tend to be characterised by a greater proportion of threatened species and suggest that this is likely a reflection of the mode of speciation, whereby new species are often range restricted and of low abundance, and thus at high risk of extinction (or at least appear to be at high risk, given IUCN Red Listing criteria). The present study adds qualified support to these findings. More rapidly diversifying (but not younger) genera tend to contain a greater proportion of threatened species. Further, in conifers, older taxa are less threatened with extinction, but there is no relationship between species age and extinction risk in palms. The authors suggest these clade differences can be explained by the contrasting modes of speciation that characterise the respective clades – conifers have diversified historically via range-shift dynamics, whereas palms have diversified by exploiting new niche space.
I am broadly sympathetic to the authors’ arguments and find the results highly believable. However, I was not convinced by the link with range filling, mostly because I do not think this metric is reliable as calculated. Occupied range is estimated using GBIF occurrence data (incidentally, summing non-equal area cells), but obviously species occur in many more areas/cells than those recorded in GBIF, and it is for this reason we frequently use SDMs to ‘fill-out’ species distributions. Without independent empirical evidence, I am unconvinced that the difference between SDM predictions and GBIF occurrence data captures range filling.
Relatedly, there is a discrepancy in the timescales of environmental change (i.e. the tens or hundreds of thousands of years over which glacial cycles occur) and species ages (which are measured in the millions of years), which undermines the authors’ environmental ‘mismatch’ hypothesis. The example of the woolly rhinoceros is illustrative: if it lost its habitat after the retreat of the last ice age ~18K years ago, it is not obvious how this should relate to its evolutionary age. Further, the alternative scenario, which suggests that older species might be more generalist, and thus better ‘matched’ to the environment, ignores the potential trade-off between specialist and generalist. I would, for example, hypothesise that specialist not generalist would show a better ‘match’ to the environment.
Evaluating range correlations of extinction risk in plants is particularly challenging as the Red List status of many species is, more or less, defined by their range size; it can, therefore, be difficult to tease apart these attributes and there is a danger of circularity. For the most part, the authors escape such pitfalls, but it might be useful to remember that extinction risk and range size may be interchangeable.
Minor Points
A PGLS model might not be the most appropriate for analysing proportion data (e.g. in the regression of taxon age against proportion of threatened species).
The analysis of range size, range filling and species age using sister-species is rather odd as sister species are, by definition, the same age. P-values are estimated using random draws of sister pairs, which I assume is why the positive slope between difference in range filling and age, with r = 0.15, is highly significant, whereas the negative slope between difference in range size and age, with r = -0.16, is not at all significant. I am not sure what to make of these analyses.
Finally, the authors should refer back to earlier papers, for example, those by Schwartz and coauthors, who explore similar patterns in extinction risks across diverse plant clades and propose similar mechanistic explanations.
https://doi.org/10.24072/pci.evolbiol.100142.rev12


