
Understanding the effects of linkage and pleiotropy on evolutionary adaptation
Pleiotropy or linkage? Their relative contributions to the genetic correlation of quantitative traits and detection by multi-trait GWA studies
Abstract
Recommendation: posted 22 November 2019, validated 26 November 2019
Lotterhos, K. (2019) Understanding the effects of linkage and pleiotropy on evolutionary adaptation. Peer Community in Evolutionary Biology, 100087. https://doi.org/10.24072/pci.evolbiol.100087
Recommendation
Genetic correlations among traits are ubiquitous in nature. However, we still have a limited understanding of the genetic architecture of trait correlations. Some genetic correlations among traits arise because of pleiotropy - single mutations or genotypes that have effects on multiple traits. Other genetic correlations among traits arise because of linkage among mutations that have independent effects on different traits. Teasing apart the differential effects of pleiotropy and linkage on trait correlations is difficult, because they result in very similar genetic patterns. However, understanding these differential effects gives important insights into how ubiquitous pleiotropy may be in nature.
In the preprint "Pleiotropy or linkage? Their relative contributions to the genetic correlation of quantitative traits and detection by multi-trait GWA studies", Chebib and Guillaume [1] explore the conditions under which trait correlations caused by pleiotropy result in similar and different genetic patterns than trait correlations caused by linkage. Their main finding is that pleiotropic architectures result in higher trait correlations than do architectures in which completely linked mutations affect different traits. This results clarifies and goes against a previous theoretical study that predicted that pleiotropic architectures could not be distinguished from completely linked mutations that affect independent traits.
In genome-wide association studies (GWAS), it is difficult to know if a significant signal is a causal variant that truly affects the trait, a false positive neutral variant linked to a causal variant, or a false positive causal variant that affects a different trait but is significant because of trait correlations. In their study, Chebib and Guillaume [1] show that this latter category can be a common source of false positives in GWAS studies when mutations affecting different traits are linked. One of the main limitation of this aspect of their analysis is the lack of simulation of neutral loci, which would likely show even higher rates of false positives than reported in their study.
The main limitation in their study is the restrictive assumptions about the genetic architectures (e.g. all pairs of loci have a fixed recombination rate among them). In reality, new causal mutations that arise near another causal mutation may have higher or lower establishment probabilities depending on the direction of effects on the trait and the parameters for selection and demography. Their study still deserves a recommendation, however, because of the new insights it gives into the genetic architecture of trait correlations.
References
[1] Chebib, J. and Guillaume, F. (2019). Pleiotropy or linkage? Their relative contributions to the genetic correlation of quantitative traits and detection by multi-trait GWA studies. bioRxiv, 656413, v3 peer-reviewed and recommended by PCI Evolutionary Biology. doi: 10.1101/656413

The recommender in charge of the evaluation of the article and the reviewers declared that they have no conflict of interest (as defined in the code of conduct of PCI) with the authors or with the content of the article. The authors declared that they comply with the PCI rule of having no financial conflicts of interest in relation to the content of the article.
no declaration
Evaluation round #1
DOI or URL of the preprint: https://www.biorxiv.org/content/10.1101/656413v1
Author's Reply, 12 Nov 2019
Decision by Kathleen Lotterhos, posted 19 Jul 2019
Both reviewers point out the merit of this simulation study, which tests verbal arguments that linked loci should behave similarly to a single pleiotropic locus. Both reviewers suggested clarifications to the text and/or extensions to the mathematics, with which I agree are necessary before this manuscript would be recommended.
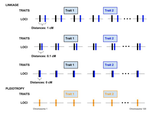
Specifically, clarification is needed for the model parameters throughout the manuscript, the figures need to be presented more clearly, and the explanation for the difference between two fully linked loci and a single pleiotropic locus needs to be made more explicit earlier in the paper. Reviewer 2 points out that there may be some important differences in the the joint distribution of mutational effects, and this need to be clarified in the manuscript. This reviewer also points out how the influence of migration may be predicted from the law of total covariance, which is worth incorporating into the manuscript. Also, clarification on the demography is needed. Is this an island-mainland model? Or a 2-patch model with asymmetrical migration? What is the population size in each patch?
Both reviewers point out that the GWAS results are not clearly presented and I agree. Major revisions will be needed in this section if the paper is going to earn a recommendation. Firstly, it seems strange to do a GWAS analysis only on causal loci and not to include simulated neutral loci for the calculation of false positive rates. Second, it is below the standard of the field to conduct a GWAS without a correction for population structure. If structure is corrected for in the model it is unclear in the manuscript, and if it is not then false positive rates could be inflated. In the context of fully linked loci, “false positives” are linked loci that have an effect on a different trait other than the one being analyzed, so they are not truly neutral and this needs to be clarified. Finally, the presentation of results in Figure 8 is not intuitive, especially for the linked architectures - is locus 1 linked to locus 121 on the same linkage group? Linkage architectures should still have Type II error rates reported (even if these are zero) in Table 1. It’s hard to figure out what the main message from Table 1 is, so a figure here might be warranted.
Overall, I agree with the reviewer that said it’s easy to get lost in the results, especially in Figures 3-6. Streamlining the message would strengthen the manuscript.
Additional requirements of the managing board:
As indicated in the 'How does it work?’ section and in the code of conduct, please make sure that:
-Data are available to readers, either in the text or through an open data repository such as Zenodo (free), Dryad or some other institutional repository. Data must be reusable, thus metadata or accompanying text must carefully describe the data.
-Details on quantitative analyses (e.g., data treatment and statistical scripts in R, bioinformatic pipeline scripts, etc.) and details concerning simulations (scripts, codes) are available to readers in the text, as appendices, or through an open data repository, such as Zenodo, Dryad or some other institutional repository. The scripts or codes must be carefully described so that they can be reused.
-Details on experimental procedures are available to readers in the text or as appendices.
-Authors have no financial conflict of interest relating to the article. The article must contain a "Conflict of interest disclosure" paragraph before the reference section containing this sentence: "The authors of this preprint declare that they have no financial conflict of interest with the content of this article." If appropriate, this disclosure may be completed by a sentence indicating that some of the authors are PCI recommenders: “XXX is one of the PCI XXX recommenders.”
Reviewed by anonymous reviewer 1, 11 Jul 2019
Reviewed by Pär Ingvarsson, 04 Jul 2019
Chebib and Guillaume investigate how linkage and pleiotropy contribute to the genetic correlation between quantitative traits. They use computer simulations to evaluate how a number of parameters, such as mutation rate, linkage and strength of stabilising and correlational selection affect genetic correlations between two quantitative traits. The results show that pleiotropy in most cases maintain a stronger genetic correlation than linkage, unless causal loci are in complete linkage. They also explore how linkage and pleiotropy affect the ability to detect causal loci in a GWAS setting.
Overall the results enhance our understanding of how linkage and pleiotropy affect the genetic correlation between quantitative traits and will be useful for interpreting results from GWAS studies of correlated traits. I only have a few comments that I think will help make the presentation more clear and aid with the interpretation of the results presented in the paper.
Major comments:
The model formulation of the selection is rather vaguely described. The strength of selection is described by the ω2 parameters and the correlational selection is given as ω2×0.5 or ω2×0.9 (line 173). However later in the manuscript, correlational selection is only described using parameter ρw. I think it would be good to include the parameter ρw in the formulation of correlational selection this more explicit. It took me a while to realise that the ρw parameter actually refers to the 0.5 and 0.9 values in the formulation on line 173.
The presentation of the GWAS results in Figure 8 is a little intuitive in light of how the simulations were set up (as presented in Figure 1). Under the linkage model, pairs of loci are linked with one locus affecting trait 1 and one lcous affecting trait 2) and individual pairs are unlinked but when GWAS results are presented in Figure 8, the loci are plotted based on whether they affect trait 1 or trait 2. I assume this is done for visualisation purposes but is a little intuitive given the description given in Figure 1. Also, this is never explicitly mentioned in the text or the figure legend.
Also, the use of grayscale in all figures is sometimes not enough to clearly distinguish different parameters (especially when error bars are small). Using different grayscales in combination with different plotting symbols (e.g. circles, triangles and diamonds) would make it easier to distinguish between different parameters in the figures. Also, making the symbols in the plots a little bit larger (like in Figure 7) would also help.
Minor comments:
Line 25: “leverage the explosion in genomic sequencing” sounds a little dangerous, I reformulate to something like “...leverage the rapid development in genome sequencing technologies”
Line 26: “on the size of the effect” - of what? Do you mean effect size of alleles?
https://doi.org/10.24072/pci.evolbiol.100210.rev12


