
Remarkable insights into processes shaping African tropical tree diversity
Phylogenomic approaches reveal how a climatic inversion and glacial refugia shape patterns of diversity in an African rain forest tree species
Abstract
Recommendation: posted 11 March 2020, validated 11 March 2020
Pirie, M. (2020) Remarkable insights into processes shaping African tropical tree diversity. Peer Community in Evolutionary Biology, 100094. https://doi.org/10.24072/pci.evolbiol.100094
Recommendation
Tropical biodiversity is immense, under enormous threat, and yet still poorly understood. Global climatic breakdown and habitat destruction are impacting on and removing this diversity before we can understand how the biota responds to such changes, or even fully appreciate what we are losing [1]. This is particularly the case for woody shrubs and trees [2] and for the flora of tropical Africa [3].
Helmstetter et al. [4] have taken a significant step to improve our understanding of African tropical tree diversity in the context of past climatic change. They have done so by means of a remarkably in-depth analysis of one species of the tropical plant family Annonaceae: Annickia affinis [5]. A. affinis shows a distribution pattern in Africa found in various plant (but interestingly not animal) groups: a discontinuity between north and south of the equator [6]. There is no obvious physical barrier to cause this discontinuity, but it does correspond with present day distinct northern and southern rainy seasons. Various explanations have been proposed for this discontinuity, set out as hypotheses to be tested in this paper: climatic fluctuations resulting in changes in plant distributions in the Pleistocene, or differences in flowering times or in ecological niche between northerly and southerly populations. These explanations are not mutually exclusive, but they can be tested using phylogenetic inference – if you can sample variable enough sequence data from enough individuals – complemented with analysis of ecological niches and traits.
Using targeted sequence capture, the authors amassed a dataset representing 351 nuclear markers for 112 individuals of A. affinis. This dataset is impressive for a number of reasons: First, sampling such a species across such a wide range in tropical Africa presents numerous challenges of itself. Second, the technical achievement of using this still relatively new sequencing technique with a custom set of baits designed specifically for this plant family [7] is also considerable. The result is a volume of data that just a few years ago would not have been feasible to collect, and which now offers the possibility to meaningfully analyse DNA sequence variation within a species across numerous independent loci of the nuclear genome. This is the future of our research field, and the authors have ably demonstrated some of its possibilities.
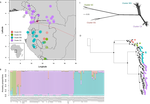
Using this data, they performed on the one hand different population genetic clustering approaches, and on the other, different phylogenetic inference methods. I would draw attention to their use and comparison of coalescence and network-based approaches, which can account for the differences between gene trees that might be expected between populations of a single species. The results revealed four clades and a consistent sequence of divergences between them. The authors inferred past shifts in geographic range (using a continuous state phylogeographic model), depicting a biogeographic scenario involving a dispersal north over the north/south discontinuity; and demographic history, inferring in some (but not all) lineages increases in effective population size around the time of the last glacial maximum, suggestive of expansion from refugia. Using georeferenced specimen data, they compared ecological niches between populations, discovering that overlap was indeed smallest comparing north to south. Just the phenology results were effectively inconclusive: far better data on flowering times is needed than can currently be harvested from digitised herbarium specimens.
Overall, the results add to the body of evidence for the impact of Pleistocene climatic changes on population structure, and for niche differences contributing to the present day north/south discontinuity. However, they also paint a complex picture of idiosyncratic lineage-specific responses, even within a single species. With the increasing accessibility of the techniques used here we can look forward to more such detailed analyses of independent clades necessary to test and to expand on these conclusions, better to understand the nature of our tropical plant diversity while there is still opportunity to preserve it for future generations.
References
[1] Mace, G. M., Gittleman, J. L., and Purvis, A. (2003). Preserving the Tree of Life. Science, 300(5626), 1707–1709. doi: 10.1126/science.1085510
[2] Humphreys, A. M., Govaerts, R., Ficinski, S. Z., Nic Lughadha, E., and Vorontsova, M. S. (2019). Global dataset shows geography and life form predict modern plant extinction and rediscovery. Nature Ecology and Evolution, 3(7), 1043–1047. doi: 10.1038/s41559-019-0906-2
[3] Stévart, T., Dauby, G., Lowry, P. P., Blach-Overgaard, A., Droissart, V., Harris, D. J., Mackinder, B. A., Schatz, G. E., Sonké, B., Sosef, M. S. M., Svenning, J. C., Wieringa, J. J., and Couvreur, T. L. P. (2019). A third of the tropical African flora is potentially threatened with extinction. Science Advances, 5(11), eaax9444. doi: 10.1126/sciadv.aax9444
[4] Helmstetter, A. J., Amoussou, B. E. N., Bethune, K., Kandem, N. G., Kakaï, R. G., Sonké, B., and Couvreur, T. L. P. (2020). Phylogenomic approaches reveal how a climatic inversion and glacial refugia shape patterns of diversity in an African rain forest tree species. BioRxiv, 807727, ver. 3 peer-reviewed and recommended by PCI Evolutionary Biology. doi: 10.1101/807727
[5] Versteegh, C. P. C., and Sosef, M. S. M. (2007). Revision of the African genus Annickia (Annonaceae). Systematics and Geography of Plants, 77, 91–118.
[6] Hardy, O. J., Born, C., Budde, K., Daïnou, K., Dauby, G., Duminil, J., Ewédjé, E.-E. B. K., Gomez, C., Heuertz, M., Koffi, G. K., Lowe, A. J., Micheneau, C., Ndiade-Bourobou, D., Piñeiro, R., and Poncet, V. (2013). Comparative phylogeography of African rain forest trees: A review of genetic signatures of vegetation history in the Guineo-Congolian region. Comptes Rendus Geoscience, 345(7), 284-296. doi: 10.1016/j.crte.2013.05.001
[7] Couvreur, T. L. P., Helmstetter, A. J., Koenen, E. J. M., Bethune, K., Brandão, R. D., Little, S. A., Sauquet, H., and Erkens, R. H. J. (2019). Phylogenomics of the Major Tropical Plant Family Annonaceae Using Targeted Enrichment of Nuclear Genes. Frontiers in Plant Science, 9. doi: 10.3389/fpls.2018.01941

The recommender in charge of the evaluation of the article and the reviewers declared that they have no conflict of interest (as defined in the code of conduct of PCI) with the authors or with the content of the article. The authors declared that they comply with the PCI rule of having no financial conflicts of interest in relation to the content of the article.
Evaluation round #2
DOI or URL of the preprint: 10.1101/807727
Version of the preprint: 1
Author's Reply, 28 Feb 2020
Decision by Michael Pirie , posted 25 Feb 2020
Dear Andrew, Thomas et al.,
I’ve taken a little time to get back to you on your revised preprint; I was glad to see your use of the reviews to improve the paper but couldn’t quite parse the response to the comments regarding the spatial diffusion analyses. The original reviewer, Miguel Navascués, took an immediate further look and has clarified the point in some detail. The bottom line is that the approach is based on the same kinds of assumptions as its discrete state predecessor (in particular with regard random sampling and in ignoring population structure when calculating the probability of the coalescent tree), and despite its popularity might deliver similarly inaccurate results when those assumptions are violated. My impression is that you sampled in order to best represent the distribution, not to represent populations in proportion to their size, so this at the least does seem potentially problematic. He suggests either to remove the analysis or to include a thorough discussion of its potential problems (in the context of your data, I would add), either of which solutions should be straightforward for you to implement.
I have included some minor further suggestions in the tracked-changes version of the text which I will forward on separately as it seems the upload function here only accepts pdf. I’ll look forward to seeing the revised – and doubtless final – version in due course.
All the best,
Mike
Additional requirements of the managing board:
As indicated in the 'How does it work?’ section and in the code of conduct, please make sure that:
-Data are available to readers, either in the text or through an open data repository such as Zenodo (free), Dryad (to pay) or some other institutional repository. Data must be reusable, thus metadata or accompanying text must carefully describe the data.
-Details on quantitative analyses (e.g., data treatment and statistical scripts in R, bioinformatic pipeline scripts, etc.) and details concerning simulations (scripts, codes) are available to readers in the text, as appendices, or through an open data repository, such as Zenodo, Dryad or some other institutional repository. The scripts or codes must be carefully described so that they can be reused.
-Details on experimental procedures are available to readers in the text or as appendices.
-Authors have no financial conflict of interest relating to the article. The article must contain a Conflict of interest disclosure paragraph before the reference section containing this sentence: The authors of this preprint declare that they have no financial conflict of interest with the content of this article. If appropriate, this disclosure may be completed by a sentence indicating that some of the authors are PCI recommenders: XXX is one of the PCI XXX recommenders.
Reviewed by Miguel de Navascués, 14 Feb 2020
Helmstetter and coauthors have addressed most of the comments raised in the previous round of review satisfactorily. However, my main concern has been dismissed by the authors without enough justification. In my previous review I argued that the method used to study spatial diffusion (i.e. BEAST + SPREAD3) is based in an artificial model that has not been properly validated. I recommended to remove it from their work. Authors have decided to maintain it and provide no evidence-based argument on the validity of the method to justify their decision. My position on this has not changed, these are my reasons:
In 2009, Lemey et al. (2009 doi:10.1371/journal.pcbi.1000520) presented a new method to make phylogeographic inferences. This method, often referred to as “mugration” or “discrete trait analysis” (DTA), is based on modeling spatial location as a discrete trait that evolves through a phylogeny/genealogy; that is, modeling migration as if it was mutation. This is not a process-driven model because it removes the influence of migration on the shape of the tree topology. In real life, the dynamics of migration are different to the dynamics of mutation. This is an utilitarian model. There is nothing wrong with an utilitarian model, as long as it is useful. Many of us welcomed the new method as promising, despite the fact that the article presenting it did not have any formal validation.
In 2015, after more than 500 citations of Lemey et al. (2009), most of them applications of the method, De Maio et al. (2015, doi:10.1371/journal.pgen.1005421) presented an evaluation of this method. This work shows that DTA suffers from severe biases in the estimation of dispersal rates, poor accuracy of the estimation spatial location of ancestral nodes and misleading measures of the uncertainty of the results. The authors of the method write about it:
“Despite their popularity, DTA make a number of restrictive assumptions that can be inappropriate when applied to the migration of lineages between geographic locations. DTA potentially under-represent ancestral trait uncertainty and are known to be sensitive to biased sampling of subpopulations.” (Baele et al. 2018, doi:10.1016/j.coviro.2018.08.009).
Today, Lemey et al. (2009) accumulates more than 1000 citations. Despite the evidence that it is unreliable, it stays in the phylogeographic toolbox. Many researchers learn about the methods they use on empirical papers dealing with similar questions. A single methodological article showing the poor performance of one method can easily be missed among hundreds of articles that apply the method without questioning its validity. It is therefore important that the community gains awareness of the problems that some methods have and that those problems are reflected on what we publish. At the bare minimum, acknowledgment of the limitations/problems of the methods must be presented and discussed, to warn the reader about the uncertainty of the results.
Helmstetter and coauthors argue, however, that they are using “continuous spatial diffusion” (Lemey et al. 2010, doi:10.1093/molbev/msq067) and not DTA. The difference of between them stems mainly on considering space as a continuous variable instead of a discrete variable. The core of the approach remains the same, treating space as a trait that evolves along the phylogeny/genealogy. On contrast with Lemey et al. (2009), Lemey et al. (2010) presents a validation of the method by means of simulations. However, those simulations were on the inferential model, that is, they simulated the evolution of a continuous trait on a given phylogeny and they called it “space”. This give us little information on the performance of the method on more realistic dynamics, where migration is explicitly modeled and changes both the “spatial state” of the lineages and the topology of the genealogies (such as the simulations by De Maio et al. 2015). As noted by De Maio et al. (2015), the problem of DTA is its use as a model of migration and not as a model of evolution of traits, purpose for which it was originally developed. Therefore, I believe there is reason to expect similar problems for the “continuous space” version of the approach. Why should changing the variable from discrete to continuous solve any problem? But if it does, where is the proof?
With all this information at hand, I can only be skeptical about the meaning of the results obtained with this approach. How can I know that the results presented in figure 2 are not just an artifact of the method? In my opinion, there are enough results from the other analyses for the authors to make their arguments on the bio-geographic processes discussed in the article. Adding the “continuous spatial diffusion” results to the article is just a risk of publishing nonsense and additional promotion of a method that has not been properly evaluated.
https://doi.org/10.24072/pci.evolbiol.100225.rev21Evaluation round #1
DOI or URL of the preprint: 10.1101/807727
Author's Reply, 10 Feb 2020
Decision by Michael Pirie, posted 13 Jan 2020
Phylogenomic data reveal how a climatic inversion and glacial refugia shape patterns of diversity in an African rain forest tree species Andrew J. Helmstetter, Biowa E. N. Amoussou, Kevin Bethune, Narcisse G. Kandem, Romain Glèlè Kakaï, Bonaventure Sonké, Thomas L. P. Couvreur 10.1101/807727 version 1
Dear Andrew and coauthors,
Reviewers have responded very positively to your ms. and have made a number of insightful and constructive comments that I am sure you will be able to make good use of. The reviewers’ comments are included (presumably) below (R1 & R2), in a separate pdf (R3) plus in an annotated copy of the pdf to which I have added further points here and there.
The main points raised:
Hypotheses and tests: It always aids the clarity of this kind of analysis to set out in the introduction all the hypotheses, as well as the results with which they could be rejected. As noted by R2 and R3, those corresponding to flowering times and niche differences are currently neglected. R2 suggests ways in which these might be addressed using the current datasets, and also moots the possibility of formal biogeographic model testing using BioGeoBEARS. These would certainly add considerable value to the paper.
Methods and assumptions: I agree with R1 on the use of methods making unrealistic assumptions about gene flow in an analysis within a species using multiple independent markers. A concatenated analysis seems like a bad idea to me in principle, and although I can’t compare the ASTRAL tree to the RAxML one (because the tips aren’t labelled – I would ask for supplementary tree files/fully labelled trees to represent the information presented in such figures) the network structure in the splitstrees result and the short branch lengths in parts of the tree do nothing to assuage my concern that the single ML tree cannot realistically represent phylogeny here. Both topology and branch lengths may be impacted by the model violation, and the strong support could just be a misleading symptom of that. R1 suggests to replace this with analysis based on multispecies coalescent. Similarly R1 suggests replacing the “mugration” approach with those implementing a structured coalescent.
Dataset and processing of SNPs R1 asks for a comparison of the datasets resulting from phylogenomic/population-level processing. I agree this would be enlightening: In addition to these comments, I would like to know how within-individual polymorphic sites are treated for the former (I see no sign of phasing; a general weakness of some pipelines in my view). How might these different ways of treating the same data potentially impact the results?
I would ask that in revision your ms. you copy all these comments into a separate response document and address each individually; ideally I would like to see changes to the ms. in the form of tracking in a word document. Just makes my life easier.
Finally, congratulations on a fine piece of work. I am looking forward to seeing a revised version.
All the best, Mike Pirie
Download recommender's annotationsReviewed by Lars Chatrou, 13 Jan 2020
Reviewed by Oscar Vargas, 16 Dec 2019
Review for PCH EVOL BIOL of the manuscript titled: “Phylogenomic data reveal how a climatic inversion and glacial refugia shape patterns of diversity in an African rain forest tree species“
The manuscript mentioned above present a phylogenomic study using targeted sequencing. Authors study one plant species distributed in the tropical rainforest of Africa trying to elucidate if its populations have genetic structure and the tentative reason for such. Authors found a sticking pattern of structure dividing northern and southern populations in accordance with previous studies; they conclude that there is some evidence supporting Pleistocene changes in forest coverage as the cause for the demographic history of the species’ populations.
This manuscript presents a pioneering effort to study historical demography in the tropical rainforest of Africa. I praise authors efforts along with their selection of methods to analyze the data. Writing is grammatically correct and clear. I believe this study is worth of being published after some adjustment to the writing, the framing of the study, and perhaps some additional analyses. With these editions/additions I believe this study will be a beautiful and exciting contribution to the field Main concerns:
Hypothesis testing. In the introduction, authors clearly stated that there are three hypotheses to explain genetic structure. Yet, they focused mainly in the Pleistocene hypothesis. A clear example is how in the introduction they stated what are the expectations under the Pleistocene hypothesis, without stating potential ways to test the other two hypotheses. Similarly, in the discussion, authors seem to solely focus on the Pleistocene hypothesis. Authors, I believe, do have the data to test the other hypotheses. For flowering times, they can simply look at herbarium records looking for differences in flowering times between populations. For the third hypothesis, using their climate data, they can test whether there are differences among the niches of the different populations–if climatic niches are different, then there is an indication for habitat filtering.
Biogeography Authors use their mapping of the specific location on the phylogeny S. fig 7, specifically the location of the sister taxa to the rest, as a historical biogeographic reconstruction and draw conclusions based on this, e.g. lines 302–313. Simply looking at the sample that is sister to the rest is not enough to draw conclusions about historical biogeography and dispersal. I suggest authors to make a bioregionalization of the area and perform a formal historical biogeographical analysis on the whole phylogeny, BIOGEOBEARS is one option.
Minor comments in pdf It was pleasure and honor to review this paper
Download the review https://doi.org/10.24072/pci.evolbiol.100225.rev12Reviewed by Miguel de Navascués, 16 Dec 2019
Helmstetter and collaborators present a study of the genetic diversity of Annickia affinis, an African rain forest tree. They study the geographic structure of its genetic diversity and they infer its demographic history. The results are discussed in relation to the climatic inversion in Central Africa, the glacial refugia and the inferred potential distribution in the past via climatic niche modelling. This study adds to a body of work on the phylogeography of Central African rain forest plants that try to shed light on the biogeographical processes in the region. Cumulative evidence from different species is very valuable to understand these processes and the present work will be a good contribution. An additional merit over previous works is the use of a larger set of molecular markers thanks to the use of high throughput sequencing technologies. However, I would not go as far as saying that this work is an exemplary study (i.e. “proof-of-concept for future work”) because the analytical methods are not particularly novel and some of them are flawed. Some of these analyses need to be revised before this work can be recommended.
1) My first concern is with the analysis of spatial diffusion based on using the evolution of a trait along the genealogies as an approximation for migration (an approach sometimes called “mugration”, i.e. “mutation as migration”). In such analysis, branch length and topology of genealogies are modelled by a panmictic coalescent model, which makes little biological sense in an analysis targeting structured populations. The justifications for the use of such an artificial, yet mechanistic, model are an easier implementation and a lower computational cost. That could be reasonable if the results were meaningful regarding the true migration dynamics. However, an evaluation of the “mugration” approach by De Maio et al. (2015, doi:10.1371/journal.pgen.1005421) shows it to have a poor performance (biased and too narrow credibility intervals). To my knowledge, the “mugration” approach has never been properly validated. Based on the De Maio et al. (2015) results, I can only recommend to remove completely this analysis from the manuscript. As an alternative, authors might explore alternative phylogeographic analysis based on the structured coalescent, for which recent methodological advances have been done by different research groups (e.g. Müller et al. 2017, doi:10.1093/molbev/msx186; Flouris et al. 2019, doi:10.1093/molbev/msz296).
2) Another issue in the analyses is the use of phylogenetic methods on concatenated sequences for intra-specific data. Concatenation is widely used in phylogenetics sensu stricto (i.e. inference of species trees). In some cases, it can be a good strategy to deal gene tree heterogeneity and large (genomic) data sets. An alternative way to address gene tree heterogeneity is the use of multispecies coalescent methods (equivalent to the structured coalescent mentioned above) which has the advantage to explicitly acknowledge the biological reality of recombination among loci. Multispecies coalescent methods have also been shown to be more robust to the presence of gene flow, taxon sampling, long branch attraction and anomalous gene trees. A recent review by Liu et al. (2015, doi:10.1111/nyas.12747) suggests that the more biologically relevant multispecies coalescent should be preferred to concatenation, which can be biased and have overinflated bootstrap values. I do not have a position on the debate on whether concatenated and coalescent approaches are more appropriate for phylogenetics, because it is not my field of research. However, for population genetic analysis, I find the use of concatenated approach unjustified. The problems that coalescent approaches addresses in phylogenetics come from the analysis of species that have dynamics closer to populations: incomplete lineage sorting, anomalous gene trees, gene flow, low divergence. Population structure analysis such as those implemented in DAPC or fastSTRUCTURE allow to uncover how genetic diversity is distributed in clusters, without imposing a hierarchical structure. The use of phylogenetic approaches forces a hierarchical structure (tree) for the data. This tree structure might be relevant if it is related to the possible population divergence processes within a species. The statistical model used to reveal that hierarchical structure is crucial to obtain relevant results and concatenation seems to force a rather unrealistic model (same gene genealogy for all loci among individuals of the same species). To me, the tree presented in figure 1D is more likely showing a mixture of true biological features (already reveled by, for instance, DAPC) and artefactual structure, supported by some misleading bootstrap values. I think figure S6 shows a more relevant result which reveals, for instance, the low confidence between the “phylogenetic” relationships between clusters EG, GC and (WG+CA). To sum up, I think that the analysis of concatenated sequences does not add any further insight to this data and can potentially be misleading.
In addition to these two main points I have some minor suggestions for the authors, concerning mainly the presentation of their work:
3) Line 92: Substitute “phylogenomic data” for “genomic data”
4) Materials and methods: Data for “phylogenetic” and population genetic methods have followed a slightly different bioinformatic process for selecting the loci/polymorphic sites to be analyzed. I think it would be useful to describe how different are this two subsets of data (from the same raw data). How many loci and polymorphic sites are presented in each subsets? How much do they overlap?
5) Line 201: A description of the cross-validation procedure for the DAPC analysis is missing. The current revision of the text does not allow the reader to understand how this procedure was performed nor how they should interpret the results presented in figure S1. In addition, this figure needs also a better description: what are the solid and dashed lines? What are the black squares? What is the meaning of the blue shadows? I do not see any maximum over the value of 40 PCs; it looks like the same results were obtained for any number of PCs.
6) Lines 381-390. I am not sure of the relevance of discussing the presence of potentially admixed individuals as “hybrids”. Is there any evidence that points towards an incipient speciation among clusters of this species? Is there evidence for local adaptation? The presence of few admixed individuals can be attributed to low gene flow or recent secondary contact, I do not see the need to invoke selection (nor to reject selection). Also “The existence of hybrids in the absence of gene flow...” seems to be a contradiction, do you mean “absence of historical gene flow” or “absence of introgression”? I am not sure you have evidence of any of this two alternatives, though.
7) Label x-axis in figures 1B and S5 in some way that the results can be compared, i.e. individuals (or groups of individuals) need to be identifiable.
https://doi.org/10.24072/pci.evolbiol.100225.rev13


