
Interplay between fecundity, sexual and growth selection on the spring phenology of European beech (Fagus sylvatica L.)
 based on reviews by 2 anonymous reviewers
Interplay between fecundity, sexual and growth selection on the spring phenology of European beech (Fagus sylvatica L.).
Abstract
Recommendation: posted 04 March 2024, validated 04 March 2024
Gonzalez-Martinez, S. (2024) Interplay between fecundity, sexual and growth selection on the spring phenology of European beech (Fagus sylvatica L.). Peer Community in Evolutionary Biology, 100657. https://doi.org/10.24072/pci.evolbiol.100657
Recommendation
Starting with the seminar paper by Lande & Arnold (1983), several studies have addressed phenotypic selection in natural populations of a wide variety of organisms, with a recent renewed interest in forest trees (e.g., Oddou-Muratorio et al. 2018; Alexandre et al. 2020; Westergren et al. 2023). Because of their long generation times, long-lived organisms such as forest trees may suffer the most from maladaptation due to climate change, and whether they will be able to adapt to new environmental conditions in just one or a few generations is hotly debated.
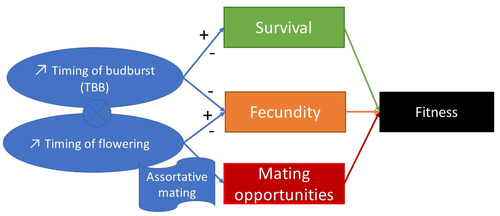
In this study, Oddou-Muratorio and colleagues (2024) extend the current framework to add two additional selection components that may alter patterns of fecundity selection and the estimation of standard selection gradients, namely sexual selection (evaluated as differences in flowering phenology conducting to assortative mating) and growth (viability) selection. Notably, the study is conducted in two contrasted environments (low vs high altitude populations) providing information on how the environment may modulate selection patterns in spring phenology. Spring phenology is a key adaptive trait that has been shown to be already affected by climate change in forest trees (Alberto et al. 2013). While fecundity selection for early phenology has been extensively reported before (see Munguía-Rosas et al. 2011), the authors found that this kind of selection can be strongly modulated by sexual selection, depending on the environment. Moreover, they found a significant correlation between early phenology and seedling growth in a common garden, highlighting the importance of this trait for early survival in European beech.
As a conclusion, this original research puts in evidence the need for more integrative approaches for the study of natural selection in the field, as well as the importance of testing multiple environments and the relevance of common gardens to further evaluate phenotypic changes due to real-time selection.
PS: The recommender and the first author of the preprint have shared authorship in a recent paper in a similar topic (Westergren et al. 2023). Nevertheless, the recommender has not contributed in any way or was aware of the content of the current preprint before acting as recommender, and steps have been taken for a fair and unpartial evaluation.
References
Alberto, F. J., Aitken, S. N., Alía, R., González‐Martínez, S. C., Hänninen, H., Kremer, A., Lefèvre, F., Lenormand, T., Yeaman, S., Whetten, R., & Savolainen, O. (2013). Potential for evolutionary responses to climate change - evidence from tree populations. Global Change Biology, 19(6), 1645‑1661.
https://doi.org/10.1111/gcb.12181
Alexandre, H., Truffaut, L., Klein, E., Ducousso, A., Chancerel, E., Lesur, I., Dencausse, B., Louvet, J., Nepveu, G., Torres‐Ruiz, J. M., Lagane, F., Musch, B., Delzon, S., & Kremer, A. (2020). How does contemporary selection shape oak phenotypes? Evolutionary Applications, 13(10), 2772‑2790.
https://doi.org/10.1111/eva.13082
Lande, R., & Arnold, S. J. (1983). The measurement of selection on correlated characters. Evolution, 37(6), 1210-1226.
https://doi.org/10.2307/2408842
Munguía-Rosas, M. A., Ollerton, J., Parra-Tabla, V., & De-Nova, J. A. (2011). Meta-analysis of phenotypic selection on flowering phenology suggests that early flowering plants are favoured. Ecology Letters, 14(5), 511-521
https://doi.org/10.1111/j.1461-0248.2011.01601.x
Oddou-Muratorio S, Bontemps A, Gauzere J, Klein E (2024) Interplay between fecundity, sexual and growth selection on the spring phenology of European beech (Fagus sylvatica L.). bioRxiv, 2023.04.27.538521, ver. 2 peer-reviewed and recommended by Peer Community In Evolutionary Biology https://doi.org/10.1101/2023.04.27.538521
Oddou-Muratorio, S., Gauzere, J., Bontemps, A., Rey, J.-F., & Klein, E. K. (2018). Tree, sex and size: Ecological determinants of male vs. female fecundity in three Fagus sylvatica stands. Molecular Ecology, 27(15), 3131‑3145.
https://doi.org/10.1111/mec.14770
Westergren, M., Archambeau, J., Bajc, M., Damjanić, R., Theraroz, A., Kraigher, H., Oddou‐Muratorio, S., & González‐Martínez, S.C. (2023). Low but significant evolutionary potential for growth, phenology and reproduction traits in European beech. Molecular Ecology, Early View
https://doi.org/10.1111/mec.17196

The recommender in charge of the evaluation of the article and the reviewers declared that they have no conflict of interest (as defined in the code of conduct of PCI) with the authors or with the content of the article. The authors declared that they comply with the PCI rule of having no financial conflicts of interest in relation to the content of the article.
EU ERA-NET BiodivERsA projects TIPTREE (BiodivERsA2-2012-15). Bilateral ANR project EXPANDTREE (2013 - SVSE 7). ANR project MeCC (ANR-13-ADAP-0006).
Evaluation round #1
DOI or URL of the preprint: https://doi.org/10.1101/2023.04.27.538521
Version of the preprint: 1
Author's Reply, 28 Jan 2024
Decision by Santiago C. Gonzalez-Martinez, posted 16 Oct 2023, validated 16 Oct 2023
The pre-print of Oddou-Muratorio and colleagues presents a thorough analysis of fecundity, sexual and growth (viability) selection in two European beech stands at contrasted altitudes. This study builds on previous work to show how selection gradients for spring phenology can be modulated by sexual selection and how environmental differences (i.e., altitudinal differences) can also have a major impact on the potential for contemporary evolution in a keystone forest tree. Two reviewers have provided positive evaluations of the pre-print. However, I agree with them in that the pre-print is hard to follow at parts (in particular the Results section), and that the art of Figure 1 can be improved, to give a better view of the context of the study. I found also interesting the reviewer suggestion of using path analysis to take into account the temporal succession of sexual, fecundity and viability selection; an idea worthwhile of further exploration.
I read carefully the pre-print myself and came out with some comments that hope will also be useful to the authors to produce an updated pre-print:
In terms of improving the comparison with other studies and understanding better the context, it would be useful that the two stands are described not only by reporting the altitude but also giving some climate (and other environmental) characteristics. It would also help if TBB (time to budburst) was translated into degree-days, a common measure that standardises for temperature differences at different locations or years. For example, in lines 135-137, the difference in number of days to budburst at the lower vs the higher plot could be due just to different temperature accumulation at the two altitudes (and that would explain also why the pattern changes in a common garden where trees were grown in the same environment). To make the translation between time in days to degree-days would help also to evaluate whether there are different local adaptation patterns at the two altitudes.
Line 222. Can you report exclusion probabilities for the 13 SSR loci? Also, line 231, I find unusual to consider “no unsampled parents” when in continuous forest tree populations is common to have a large among of external gene flow. Can you provide a rationale for this?
Line 306. Can you provide the equation for this model?
I understand (as also suggested by one of the reviewers) that the common garden was probably established with other objectives, but that it came handy to test for viability selection in this study. If this is the case, can you provide a reference to the full analysis of the common garden? In particular the part related to the drought treatment is not very well described in the pre-print (although it is important for the interpretations and conclusions developed in the Discussion section). Also, the reader is left wondering about the genetic components that could be computed using the family structure of the common garden (e.g., genetic selection gradients computed using bivariate models or heritability estimates).
Line 351. A piece of the sentence is repeated.
Line 411. “as the best one”
Finally, I advise to tone down the end of the Discussion, as even a higher-than-average selection gradient may not translate in a significant response to selection (for which both the phenotypic variance and the heritability of the trait are important), in particular if the selection gradient proved not to be consistent across years.
Reviewed by anonymous reviewer 1, 06 Jul 2023
Reviewed by anonymous reviewer 2, 25 Sep 2023
This paper by Oddou-Muratorio et al. analyses the different selection components of phenology. In their conceptual framework, the authors explore fecundity and viability selection on phenological traits and their relationship with sexual selection by assortative mating, using two plots dominated by Fagus sylvatica (European beech) with 300 m of difference in altitude. Authors regressed fecundity vs. the phenological mismatch on the timing of bud burst (TBB) as a proxy of the sexual selection. The regression between fecundity and TBB was used as the proxy of fecundity selection. And the regression of TBB vs. seedlings growth (greenhouse experiment) was used as the proxy of viability selection.
I find that this manuscript presents an interesting collection of field and greenhouse data. The authors combine genetic analyses from seeds and seedlings collected in the field for estimating paternity and parentage with seedling growing data from a greenhouse with a drought treatment. The paper is well written and the statistical analyses seem appropriate (although I do not understand why phenological mismatch has negative values in fig. 5 are negative, see my comments below). My main concern is that results seem to be too specific of the study plots, female or male fertility, age of individuals and altitude, being difficult to generalize. Also, the combination of data needs more rationale behind. For instance, the spatial design of the study includes an elevational gradient, although with only two plots separated by only 300 m in altitude. This is not so much regarding the distribution range of beech in the area (from 750 to 1700 m a.s.l). But above all, it is not clear how the altitudinal gradient is going to affect different selection types on the phenology. I am missing a more formal hypothesis regarding this. Similarly, the inclusion of a drought treatment for the seedling experiment in the greenhouse needs more justification and link with the main objective of the manuscript (i.e., detecting selection gradients). I have the impression that the manuscript collates data originally designed for other independent studies and the internal logic of the design is difficult to discern.
In the discussion section, the authors explain assortative mating at the lowest elevation because phenology was more spread out. But this could be also being an effect of higher beech density. How can these two factors be separated?
In short, I believe that the manuscript is a very valuable piece of science, although I consider that it should clarify a bit more the rationale for the combination of methods. Also, it has numerous tables that I believe that could be summarized or included in the supplementary material. A more organized description of the results according to the original framework (three selection types, three proxies of it) would clarify the message for the reader.
Minor edits:
L22. Include the species name here.
L23. Here and elsewhere, the authors use the term “low altitude” for referring to plot N1, which is 1,020 m a.s.l. I consider that this gives a fake impression of low altitude to the reader, whereas it corresponds to a relatively high altitude compared to other systems. I suggest to use another term throughout the text such as “mid altitude” or something equivalent.
L49. Define microevolution.
L84. I suggest including here a reference that all the hypotheses are for “temperate ecosystems”.
L93. I believe that this sentence is incomplete. Please, rewrite it.
L147-150. These two sentences read very repetitive, try to improve the writing of them.
Figure 1. Try to improve the aesthetics of this figure. For instance, I cannot understand why you use a flag for assortative mating, the same for the circle with the cross. The right sided arrows are supposed to indicate delays in timing, but this is not intuitive.
L163. Remove hyphen for Mont Ventoux.
L166. I suggest changing the name of the plots for more informative ones. Plots N1 and N4 seem to me as names used for field work, but they are not intuitive for readers not working at Mont Ventoux (the majority). For instance, why they are not included plots N2 and N3 in the analyses? I recommend to change these names to “mid-altitude” and “high-altitude” plots. In fact, the authors have done so in figure 5, entitling the sites as “low altitude” and “high altitude”. However, I consider that 1000 m a.s.l. (N1) is not exactly low altitude, so a better term should be used. In addition, when reading results, it is difficult to remember which plot was high and which one was low with the current names. I believe that is better to include a name for the plots that gives information on the elevation gradient instead of the field design.
L190. As the number of visiting dates was different per plot, should not the phenological score sum (PSS) be divided by the total number of visits?
L237. Reference for the MEMM software is missing.
L331. This is not a clear reference, try to include the entire URL to the supplementary file instead.
L351. Italics for lmer and lme4. Citation of the package needs to be included.
L356. Instead of the mean, it is more informative to include the median or even the peak for phenological information on days (because it is a discrete variable).
L375. Put space always after and before =
Table 2, heading. The name of the function used should not be included in the results, but in the description of methods. Also, include the reference of the package where this function comes from.
Figure 5. Why do you have negative value for the absolute mismatch (while the formula indicates the absolute value)?
L454. Put the exact reference of the appendix (including URL) here.
Fig. 8s. If you find that this figure is critical, include it in the main text
https://doi.org/10.24072/pci.evolbiol.100657.rev12


