
An ancient age of open-canopy landscapes in northern Madagascar? Evidence from the population genetic structure of a forest tree
How ancient forest fragmentation and riparian connectivity generate high levels of genetic diversity in a micro-endemic Malagasy tree
Abstract
Recommendation: posted 04 November 2021, validated 12 November 2021
de Navascués, M. (2021) An ancient age of open-canopy landscapes in northern Madagascar? Evidence from the population genetic structure of a forest tree. Peer Community in Evolutionary Biology, 100136. https://doi.org/10.24072/pci.evolbiol.100136
Recommendation
We currently live in the Anthropocene, the geological age characterized by a profound impact of human populations in the ecosystems and the environment. While there is little doubt about the action of humans in the shaping of present landscapes, it can be difficult to determine what the state of those landscapes was before humans started to modify them. This is the case of the Madagascar grasslands, whose origins have been debated with arguments proposing them either as anthropogenic, created with the arrival of humans around 2000BP, or as ancient features of the natural landscape with a forest fragmentation process due to environmental changes pre-dating human arrival [e.g. 1,2]. One way to clarify this question is through the genetic study of native species. Population continuity and fragmentation along time shape the structure of the genetic diversity in space. Species living in a uniform continuous habitat are expected to show genetic structuring determined only by geographical distance. Recent changes of the habitat can take many generations to reshape that genetic structure [3]. Thus, we expect genetic structure to reflect ancient features of the landscape.
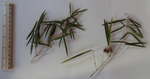
The work by Jordi Salmona and collaborators [4] studies the factors determining the population genetic structure of the Malagasy spiny olive (Noronhia spinifolia). This narrow endemic species is distributed in the discontinuous forest patches of the Loky-Manambato region (northern Madagascar). Jordi Salmona and collaborators genotyped 72 individuals distributed across the species distribution with restriction associated DNA sequencing and organelle microsatellite markers. Then, they studied the population genetic structure of the species. Using isolation-by-resistance models [5], they tested the influence of several landscape features (forest cover, roads, rivers, slope, etc.) on the connectivity between populations. Maternally inherited loci (chloroplast and mitochondria) and bi-parentally inherited loci (nuclear), were analysed separately in an attempt to identify the role of pollen and seed dispersal in the connectivity of populations.
Despite the small distribution of the species, Jordi Salmona and collaborators [4] found remarkable levels of genetic diversity. The spatial structure of this diversity was found to be mainly explained by the forest cover of the landscape, suggesting that the landscape has been composed by patches of forests and grasslands for a long time. The main role of forest cover for the connectivity among populations also highlights the importance of riparian forest as dispersal corridors. Finally, differences between organelle and nuclear markers were not enough to establish any strong conclusion about the differences between pollen and seed dispersal.
The results presented by Jordi Salmona and collaborators [4] contribute to the understanding of the history and ecology of understudied Madagascar ecosystems. Previous population genetic studies in some forest-dwelling mammals have been interpreted as supporting an old age for the fragmented landscapes in northern Madagascar [e.g. 1,6]. To my knowledge, this is the first study on a tree species. While this work might not completely settle the debate, it emphasizes the importance of studying a diversity of species to understand the biogeographic dynamics of a region.
References
1. Quéméré, E., X. Amelot, J. Pierson, B. Crouau-Roy, L. Chikhi (2012) Genetic data suggest a natural prehuman origin of open habitats in northern Madagascar and question the deforestation narrative in this region. Proceedings of the National Academy of Sciences of the United States of
America 109: 13028–13033. https://doi.org/10.1073/pnas.1200153109
2. Joseph, G.S., C.L. Seymour (2020) Madagascan highlands: originally woodland and forest containing endemic grasses, not grazing-adapted grassland. Proceedings of the Royal Society B: Biological Sciences 287: 20201956. https://doi.org/10.1098/rspb.2020.1956
3. Landguth, E.L., S.A. Cushman, M.K. Schwartz, K.S. McKelvey, M. Murphy, G. Luikart (2010) Quantifying the lag time to detect barriers in landscape genetics. Molecular Ecology 19: 4179–
4191. https://doi.org/10.1111/j.1365-294X.2010.04808.x
4. Salmona J., Dresen A, Ranaivoson AE, Manzi S, Pors BL, Hong-Wa C, Razanatsoa J, Andriaholinirina NV, Rasoloharijaona S, Vavitsara M-E, Besnard G (2021) How ancient forest fragmentation and riparian connectivity generate high levels of genetic diversity in a micro-endemic Malagasy tree. bioRxiv, 2020.11.25.394544, ver. 4 peer-reviewed and recommended by Peer Community in Evolutionary Biology. https://doi.org/10.1101/2020.11.25.394544
5. McRae, B.H. (2006) Isolation by resistance. Evolution 60: 1551–1561. https://doi.org/10.1111/j.0014-3820.2006.tb00500.x
6. Rakotoarisoa J.-E., M. Raheriarisena, S.M. Goodman (2013) Late Quaternary climatic vegetational shifts in an ecological transition zone of northern Madagascar: insights from genetic analyses of two endemic rodent species. Journal of Evolutionary Biology 26: 1019–1034. https://doi.org/10.1111/jeb.12116

The recommender in charge of the evaluation of the article and the reviewers declared that they have no conflict of interest (as defined in the code of conduct of PCI) with the authors or with the content of the article. The authors declared that they comply with the PCI rule of having no financial conflicts of interest in relation to the content of the article.
This work was mostly funded through an ERA-NET BiodivERsA project: INFRAGECO (Inference, Fragmentation, Genomics, and Conservation, ANR-16-EBI3-0014). We also thank the LABEX TULIP (ANR-10-LABX-0041) and CEBA (ANR-10-LABX-25-01), and the LIA BEEG-B (Laboratoire International Associé – Bioinformatics, Ecology, Evolution, Genomics and Behaviour, CNRS).
Evaluation round #2
DOI or URL of the preprint: https://www.biorxiv.org/content/10.1101/2020.11.25.394544
Version of the preprint: 2
Author's Reply, 25 Oct 2021
Decision by Miguel de Navascués , posted 26 May 2021
Dear Jordi Salmona, Guillaume Besnard and coauthors,
Thank you for the thorough revision of your manuscript. You have satisfactorily addressed the concerns raised by the reviewers.
However, in the evaluation of your reply it has come to my attention an important problem that was overlooked in the previous round of review. At different parts of the manuscript you refer to “genetic diversity”, “heterozygosity”, “Ho”, “He”, and “% of polymorphic sites” regarding nuclear RADseq data. After carefully reading all the relevant text and supplementary materials I conclude that in all of these instances you are referring to the same measurement: the individual heterozygosity per base pair, that is, for each individual the number of heterozygous sites over the total of sequenced data (after application of relevant filters). First, the text needs to state this more clearly and use a consistent name for that measurement throughout the entire work. Second, individual heterozygosity is a poor measure of genetic diversity. For instance, it can be affected by the reproductive system (i.e. clonal or selfing reproduction). Expected heterozygosity (per bp, i.e. π) calculated among individuals of the same forest patch (for comparisons among populations) or over all individuals (for comparisons with other species) is a more appropriate measure and what most readers expect as a measure for genetic diversity, please add this or an equivalent measure to your work. Since the levels of genetic diversity are one of the main results from the work this problem needs to be addressed before the work can be recommended.
In addition to this main point there are some other minors points that I would like you to consider:
In the discussion you suggest that current landscape structure must have been in place “at least 40 generations” corresponding to “at least ~800 years”. I think there is little justification for those numbers even in the light of the results by Landguth et al., (2010) and Mona et al. (2014). The dynamics of how pattern change through time in non-equilibrium models depends on many unknown parameters (effective population sizes, migration rate…), giving such precise numbers seems misleading. While I agree with the general message and I understand that this sentence was intended to address a point Yurena Arjona raised in her review, I think it would be more appropriate to discuss that the number of generations for the period with data on forest cover (1953-present) represent less that 5 generations, which seems too low to erase the signal of previous population structure (or lack of).
Please verify that the description of header for Table S1 is complete and accurate.
In line 617, I suggest to write “geographical distance” instead of “Euclidean distance”.
Last, I would like also to suggest you considering an alternative wording for fragmentation/forest fragments throughout the text. Since one of the conclusion of the work is that the landscape structure with open areas is a relatively old feature, it is unclear to me whether there was ever an ancient continuous forest in the region subsequently fragmented (presumably by humans). Thus forest patches might be just that, “patches” and not “fragments”.
Evaluation round #1
DOI or URL of the preprint: https://www.biorxiv.org/content/10.1101/2020.11.25.394544
Version of the preprint: 1
Author's Reply, 16 May 2021
Decision by Miguel de Navascués, posted 07 Jan 2021
Dear Jordi Salmona, Guillaume Besnard and coauthors, I have now received the reviews for your manuscript. While they are in general positive, both point out few concerns regarding the methods, conclusions and writing that require further work on the manuscript. Please consider all their comments carefully before submitting a revised version for evaluation. I believe most of these points can be addressed by working on the text and no further analysis will be necessary. However, pay special attention to properly justify the absence of new analysis regarding the concerns on the methodology. Both reviewers highlight the lack of explanation for the reduction of samples from sampling to genotyping. Please revise your text so it is completely clear for the reader why there are such differences. In addition, clarify how the survey of Noronhia was conducted and if N. spinifolia was identified in the field. Were all Noronhia spp. sampled? In the main text it is unclear if the 220 samples are from Noronhia spp. or from N. spinifolia only (in the supplementary text it is clearly stated, but I think the reader should not need to go there for this basic information). Another question that seems to require a more clear explanation is the discussion of the age of forest fragmentation in the area. I believe that some of the confusion stems from the better fit of the genetic distances with data on recent vegetation cover (2000’s) but a conclusion that forest fragmentation structuring the genetic diversity of N. spinifolia must be ancient. It might not be clear for the reader why data on older vegetation cover does not explain better the genetic structure of N. spinifolia. I also have some points I would like you to address: 1) Regarding the discussion on the role forest cover for seed dispersal (lines 497-509), it is not obvious to me why patterns of mtDNA and cpDNA haplotype networks would be incompatible with the signal found by IBR analysis on organelle data. I would appreciate if you could develop this point. 2) Supplementary data availability: In addition to making available the missing Table S1, please consider making supplementary tables S6, S7 and S8 available through reputed repositories (such as institutional repositories, Zenodo, DataDryad, supplementary material in bioRxiv...) that can assure long term accessibility to those files (instead of Google Drive/Docs service). Also, I could not find reference PRJNA632767 in the Sequence Read Archive (SRA) NCBI database, make sure the reference is correct and it is accessible. 3) line 59: "tropical biodiversity hotspots" instead of "tropical hotspots" 4) line 72: Specify what 40-50% are referring to (area?) 5) lines 324-5: It is unclear what the values “m=4, M=5, N=8” are. Please clarify: a brief description/definition (such as in figure S5) should be included in the main text when and in the supplementary materials (Method S6) when they are first mentioned. 6) line 466: instead of “prehistoric”, which strictly refers to the time period before the invention of writing, use “non recent” or some other wording. 7) Table S2: What is the difference between columns “Allele number” and “Number of alleles”? Best regards, Miguel Navascués **Additional requirements of the managing board**: We would like to receive your revision within 2 months. If you need more time, just tell us. As indicated in the 'How does it work?’ section and in the code of conduct, please make sure that: -Data are available to readers, either in the text or through an open data repository such as Zenodo (free), Dryad or some other institutional repository. Data must be reusable, thus metadata or accompanying text must carefully describe the data. -Details on quantitative analyses (e.g., data treatment and statistical scripts in R, bioinformatic pipeline scripts, etc.) and details concerning simulations (scripts, codes) are available to readers in the text, as appendices, or through an open data repository, such as Zenodo, Dryad or some other institutional repository. The scripts or codes must be carefully described so that they can be reused. -Details on experimental procedures are available to readers in the text or as appendices. -Authors have no financial conflict of interest relating to the article. The article must contain a "Conflict of interest disclosure" paragraph before the reference section containing this sentence: "The authors of this preprint declare that they have no financial conflict of interest with the content of this article." If appropriate, this disclosure may be completed by a sentence indicating that some of the authors are PCI recommenders: “XXX is one of the PCI XXX recommenders.”
Reviewed by Katharina Budde, 06 Jan 2021
The Manuscript „How ancient forest fragmentation and riparian connectivity generate high levels of genetic diversity in a micro-endemic Malagasy tree“ written by Salmona et al. deals with an interesting topic in a very interesting and understudied ecosystem. The authors used chloroplast SSRs and RADseq loci from the chloroplast, mitochondrial and nuclear genomes to study the genetic diversity and genetic structure of a narrow endemic tree species, Noronhia spinifolia in Madagascar. The study presents interesting data and results and is well written, nevertheless I have some concerns that I will lay out in detail below and that I hope will be helpful for the authors to improve the manuscript.
Study species: In this section I am missing some more information e.g. about the flowering and fruit phenology of the study species. Is this a monoecious or dioecious species? Are the flowers hermaphroditic or are female and male flower parts separated on the same individual? Please also add information about the possible pollen dispersal and seed dispersal mechanisms. If no literature is available for this particular species the flower and fruit morphology can already give an idea.
Sample numbers: 220 leaf samples collected, DNA extracted from 137 samples and after quality control only 72 samples were used for genotyping and sequencing. Why could only so few samples be used at the end?
The methods appear mostly sound but sometimes I am missing details:
A minimum coverage of 4x for the RADseq seems very low to me and I am wondering why the authors chose such a low threshold. Anyway, it is good that the authors used both called genotypes and genotype likelihoods! Could a higher threshold for the minimum coverage have improved the genotype calling in STACKs?
What about linkage disequilibrium at nuclear loci? I could only find information for the organellar loci. And which markers were used for NgsAdmix and ADMIXTURE? Did the authors take care to remove loci showing high LD?
I am missing Table S1 (if there is a link in blue, it did not work for me).
The authors mention that they focus on the mature trees. Why did they make this choice? For the future, I think a comparison between mature and young trees might be interesting to evaluate the effect of more recent forest fragmentation.
l. 289 I suggest to substitute “diversity” with “structure” as the authors do not test the effect of environmental factors on genetic diversity estimates but rather the effect on the genetic distance or relationship matrices. Is this correct? It might be helpful to actually mention which measures were tested for correlation. In the following paragraph the authors only mention “genetic matrices”.
l. 391What is the null IBD layer? Do you mean a null model only taking into account IBD? Please clarify.
Figure 4C Is “Percent of tree cover geographic distance” referring just to a pair-wise distance or is it a conductance measure? Please clarify! I find it sometimes difficult to follow the authors to which kind of estimate (pair-wise distance, resistance etc.) they are referring. Please revise the manuscript accordingly.
l. 441” …polymorphic cpSSRs (35)…” what exactly is the 35 referring to?
l. 447-450 Is it meaningful to directly compare the genetic diversity levels between species with such different life history traits as a tree species and mammal species (here mouse lemurs and plains zebras)? Also, why did the authors pick these species and not others? Tree species are characterized by harboring huge amounts of standing genetic variation (e.g. Petit & Hampe 2006, https://doi.org/10.1146/annurev.ecolsys.37.091305.110215). The authors have already illustrated well the big difference in diversity levels in the sentences before by comparing with other tree species. Therefore, I would suggest to remove these sentences.
The authors explain their results by a long-standing forest fragmentation in the LM region (l. 521) which is in line with other studies suggesting that forests were already fragmented before intensified human use in some regions of Madagascar. Do they have any idea if the areas surrounding the current forest patches might have been historically covered by a different vegetation type where N. spinifolia was not present? Are there other environmental factors that are correlated with forest cover, e.g. soil type that might be less suitable for N. spinifolia?
Another or additional possible explanation for the high genetic diversity and structuring, as also mentioned by the authors, might be hybridization with closely related species and I very much agree with this. Could it also be a case of cryptic radiation as it has been reported for several groups on Madagascar (but see also Pillon et al. 2014; doi: 10.1111/nph.12677)? Noronhia habors many micro-endemic species in Madagascar and I agree that a more exhaustive sampling of all possible closely related species and taking into account morphological and ecological features in future analyses might shed further light on hybridization, ecotype differentiation and speciation.
l. 231 …site frequency spectrum/ spectra?..
l. 244 Do you mean pair-wise estimates?
l. 252 remove “the” before Nei´s and Yang´s
l. 267 remove s at the end of dispersals
l. 319 and 320 I would suggest using no LD instead of null LD
l. 377 from and to?
l. 383 are shown
l. 429 I suggest to change genetic diversity to genetic structure
l. 443 Add an s to level
l. 473 …accelerated evolutionary rate…
l. 531 over a larger timeframe
l. 846-851 Prunier et al 2015 is listed twice in the references
https://doi.org/10.24072/pci.evolbiol.100363.rev11


