
Discerning the causes of local deviations in genetic variation: the effect of low-recombination regions
 based on reviews by Claire Merot and 1 anonymous reviewer
Distinct patterns of genetic variation at low-recombining genomic regions represent haplotype structure
Abstract
Recommendation: posted 14 February 2024, validated 14 February 2024
Fumagalli, M. (2024) Discerning the causes of local deviations in genetic variation: the effect of low-recombination regions. Peer Community in Evolutionary Biology, 100711. https://doi.org/10.24072/pci.evolbiol.100711
Recommendation
In this study, Ishigohoka and colleagues tackle an important, yet often overlooked, question on the causes of genetic variation. While genome-wide patterns represent population structure, local variation is often associated with selection. Authors propose that an alternative cause for variation in individual loci is reduced recombination rate.
To test this hypothesis, authors perform local Principal Component Analysis (PCA) (Li & Ralph, 2019) to identify local deviations in population structure in the Eurasian blackcap (Sylvia atricapilla) (Ishigohoka et al. 2022). This approach is typically used to detect chromosomal rearrangements or any long region of linked loci (e.g., due to reduced recombination or selection) (Mérot et al. 2021). While other studies investigated the effect of low recombination on genetic variation (Booker et al. 2020), here authors provide a comprehensive analysis of the effect of recombination to local PCA patterns both in empirical and simulated data sets. Findings demonstrate that low recombination (and not selection) can be the sole explanatory variable for outlier windows. The study also describes patterns of genetic variation along the genome of Eurasian blackcaps, localising at least two polymorphic inversions (Ishigohoka et al. 2022).
Further investigations on the effect of model parameters (e.g., window sizes and thresholds for defining low-recombining regions), as well as the use of powerful neutrality tests are in need to clearly assess whether outlier regions experience selection and reduced recombination, and to what extent.
References
Booker, T. R., Yeaman, S., & Whitlock, M. C. (2020). Variation in recombination rate affects detection of outliers in genome scans under neutrality. Molecular Ecology, 29 (22), 4274–4279. https://doi.org/10.1111/mec.15501
Ishigohoka, J., Bascón-Cardozo, K., Bours, A., Fuß, J., Rhie, A., Mountcastle, J., Haase, B., Chow, W., Collins, J., Howe, K., Uliano-Silva, M., Fedrigo, O., Jarvis, E. D., Pérez-Tris, J., Illera, J. C., Liedvogel, M. (2022) Distinct patterns of genetic variation at low-recombining genomic regions represent haplotype structure. bioRxiv 2021.12.22.473882, ver. 3 peer-reviewed and recommended by Peer Community in Evolutionary Biology. https://doi.org/10.1101/2021.12.22.473882
Li, H., & Ralph, P. (2019). Local PCA Shows How the Effect of Population Structure Differs Along the Genome. Genetics, 211 (1), 289–304. https://doi.org/10.1534/genetics.118.301747
Mérot, C., Berdan, E. L., Cayuela, H., Djambazian, H., Ferchaud, A.-L., Laporte, M., Normandeau, E., Ragoussis, J., Wellenreuther, M., & Bernatchez, L. (2021). Locally Adaptive Inversions Modulate Genetic Variation at Different Geographic Scales in a Seaweed Fly. Molecular Biology and Evolution, 38 (9), 3953–3971. https://doi.org/10.1093/molbev/msab143

The recommender in charge of the evaluation of the article and the reviewers declared that they have no conflict of interest (as defined in the code of conduct of PCI) with the authors or with the content of the article. The authors declared that they comply with the PCI rule of having no financial conflicts of interest in relation to the content of the article.
This work was supported by the Max Planck Society (Max Planck Research Group grant MFFALIMN0001 to ML), the DFG (project Z02 and Nav05 within SFB 1372 - Magnetoreception and Navigation in Vertebrates to ML), and DFG Research Infrastructure NGS_CC (project 407495230) as part of the Next Generation Sequencing Competence Network (project 423957469). AR was supported by the Intramural Research Program of the NHGRI, NIH (1ZIAHG200398).
Evaluation round #1
DOI or URL of the preprint: https://doi.org/10.1101/2021.12.22.473882
Version of the preprint: 2
Author's Reply, 07 Feb 2024
Decision by Matteo Fumagalli, posted 20 Dec 2023, validated 21 Dec 2023
The preprint has been reviewed by two experts in the field. They both found the study of merit and suggested several points to modify, mostly in the presentation of the methods. There are also several additional analyses which are suggested to do. While not all of them would add significantly to the study, I would encourage the Authors to at least attempt to reply to each point raised.
Reviewed by Claire Merot, 24 Nov 2023
Principal component analysis (PCA) are increasingly used to capture and understand the distribution of genetic variation accross many samples and along the genome. In fact, PCA can also be performed on windows along the chromosomes, a method called local PCA (Ralph and Li, 2019) that put in evidence discrepancies in the structure of genetic variation. It is most frequently used to detect non-recombining haploblocks typically induced by chromosomal rearrangements but may also reveal any long block of linked loci whether this is due to reduced recombination, selection, low migration, etc.
The present article provides a very relevant and in-depth exploration of how the recombination landscape may affect local PCA patterns both in empirical data (Blackcap) and simulated data. The results highlight that low recombination on its own may explain outliers windows in which PCA patterns show consistency among several adjacent windows. While this results may be expected, it nicely complement other previous exploration of the methods that did not clearly distinguished cases with and without linked selection.
The overall result makes sense given how important LD is in driving PCA patterns. The methods used to explore the data and infer results are sound and well-explained. Actually, reading the methods section, we discover that much more has been done that what is visible in the results. In fact, beyond the methodological emphasis, the paper also provides a thorough exploration of patterns of genetic variation along the genome of blackcap, demonstrating the presence of at least one or two polymorphic inversions, as well as the geographic structure of the species. I do believe the results could be a little more complete to include a few information on the new reference genome, the strong work done to confirm the inversion on chromosome 12, and the in-depth exploration of the simulations.
The discussion is slightly long but really well-written. It explains very well tricky concepts such as genealogy, recombination impact, etc…It serves well the purpose to understand the subtilty of the simulation results. The figures are beautiful and clear. I particularly appreciated the schematic conceptualisation. Supplementary materials is dense and reflects how much work has gone in each sub-part of this paper. It is thus even more impressive to end up with a very clear manuscript unified in a single message.
Overall, this article was a pleasure to read, is relevant for current research in evolutionary genomics, and I have very few comments.
Thank you for inviting me to review
Claire Mérot
· Major comments :
1- Important informations are missing. What is the size of the clusters of windows? How does such parameter, that will also depend on the density of SNPs may impact the results ?
2- The introduction and review of existing litterature tends to be caricatured. There is no need to claim that low-recombination alone was not considered before to make this study relevant. On the contrary, most localPCA studies have uncovered inversions and low-recombining regions (with or without support for additional selection). Several papers have considered the impact of low-recombination on genetic statistics (Booker et al 2020, Lotterhos, 2019 among others). The present study is nevertheless welcomed and timely, adding up on those previous by formerly showing how localPCA behave in simulated data with and without selection.
3- The relationship between low-recombination and PCA outilers is not fully explored. Most (All ?) PCA outliers, as defined by showing consistent patterns of variation in a MDS, are also regions of low recombination including inversions. On the contrary, are there regions of low recombination that are not detected as outliers of PCA ? If yes, what are the genomic features that differentiate them from the ones being outliers ? Knowing that in both empirical and simulated data could help understanding, on the one hand, the power of this analysis, and on the other hand, what are the necessary conditions and what are additional factors possibly captured by local PCa analyses.
4- There is some inconsistencies in the text. Most of the results and the text explain that linked selection may or may not be present, which is fine and cautious, but some sections take shortcuts and claim the absence of selection. This may be misleading. I suggest sticking to the former rather than the latter. Additional tests than localPCA can and should be done to study selection – in the same way that additional proofs are needed to confirm a putative inversions detected by local PCA.
5- There is no mention on the impact of population size, despite a choice for a low Ne in the simulation – 1000 individuals split in 3 populations). What could be the impact of such parameter? How could that explain the pattern in Island populations? Intuitively a lower Ne means less opportunity for recombination, less different genealogies…
· Minor comment
Title : It feels slightly unclear and expected- any region will reflect a structure of haplotypes, but the haplotype length depends on recombination rate –
è Maybe « haplotype structure rather than population structure » to be more explicit ?
è Also given that the focus is on local PCA rather than other ways to study genetic variation, perhaps that can be explicit ?
è Or highlight the importance of recombination rate rather than just low-recombining regions ?
L6 what does « too few genealogies » means ? too few generation to recombine ? too few ancestors ? too few distinct lines ? More generally, reading the abstract, the word genealogy may need a definition
L7 what does « distinct patterns of genetic variation » means ? perhaps « as displayed on PCA » ?
L10 « with reduced recombination rate » ? or rather with the recombination landscape » ?
L36 « a sufficient number of variable sites » -> a sufficient number of *unlinked* sites. Best practices often recommend LD pruning before structure or clustering analyses.
L42. Summarising with measure on the entire genome may not even be enough. For exemple, some regions of low-recombination (e.g. inversions) can not only take over local patterns but also global patterns (affecting a PCA on all the genome). Of course, I have our study on the seaweed flies in mind (Mérot et al 2021) but the same has been observed in many species, particularly marine ones (cod, capelin, etc). This is one of the reasons why it may also be useful to explore local patterns of PCA and how the heterogeneity in recombination rate impacts the structure of genetic variation.
L56-58 : « Distinct patterns of local genetic variation identified with genome scans are often attributed to the effects of selective factors instead of randomness (Burri, 2017; Mérot et al., 2021) based on the assumption that the genomic intervals are large enough to eliminate random fluctuation of genealogies (Li & Ralph, 2019) ». Here the references given do not support this assertation. On the contrary, the method of local PCA from Li & Ralph 2019, and used in Mérot et al 2021 precisely does the opposite. It relies on distinct patterns in PCA variation to uncover genomic regions with underlying haplotype structure. This haplotype structure may be due to several factors including low recombination (centromeres, chromosomal inversions, heterogeneity in recombination landscape) with or without linked selection – like in the blackcap system in fact! For exemple no selection is needed to explain the haplotype structure due to inversions (and thus the specific local PCA), simply the reduction of recombination is enough. Then the inversion may or may not be under selection. The value of the present paper is to explicitly simulate cases with and without linked selection to explore how an analysis of localPCA behaves.
Results : not a single words about the genome assembly ? About the extensive confirmation of inversion breakpoints ?
L98 : windows of 1000 SNPs (worth mentioning here because methods are at the end)
L99 : Outliers in the nMDS analysis are not exactly windows with distinct patterns, they are rather groups of windows with the same exact pattern which differs relatively to a background of windows with heterogeneous patterns)
L101 : which threshold ? – give briefly parameters
L302 : 32 regions from Xmb to Xmb (mean length) each including X SNps to X SNPs
L104 : low-recombining regions, defined as regions with a recombination rate below X ?, were ….
L106 : how many outliers regions coinciding with species wide vs. Pop specific low rec regions ? Are there outliers regions outside low-rec regions or not a single one ?
L119-123 : What are the arguments/results supporting inversions beyond LD ? What are the patterns of LD consistent with non-inversion haplotype blocks ?
That was very interesting to fully see the exploration in supplementary materials. In Fig S10 I am not sure one can neither exclude or support an inversion-like region for outliers 6,14 and 28. In particular, the low frequency of the B allele at outlier 6 and outlier 14 probably means that most SNPs are within AA rather than between A and B, possibly explaining the persistence of LD in AA. Those regions are also very small 100-300 kb, with additionnal geographic structure, making it difficult to pinpoint the cause of the three clusters. I agree that Outlier 30 is much bigger (1.5Mb) and more typical of simple polymorphic inversion. [ I realised that this comment is useless for a review, please simply try to be more explicit for the readers about what are the reasons that suggest inversion-like recombination reduction vs. Low-recombination due to other possible mechanisms]
L126 « spread in PCA projections » -> on PC1 and PC2. Does this pattern holds true over more PCs ? Variance is hardly interpretable with a subset of PCs. The authors may be interested in checking Elhaik preprint. The title and message are very extreme but there may still be a few things to take from it regarding the interpretation of PCA.
Why most Principal Component Analyses (PCA) in population genetic studies are wrong. Eran Elhaik bioRxiv 2021.04.11.439381; doi: https://doi.org/10.1101/2021.04.11.439381
Figure 4 : I suggest writing on the side B/C low rec ; D high rec, for quick reading. Or adding a little drawing of recombination landscape and pointing where the windows looked at in B/C and D are.
L204 « distinct patterns of genetic variation » - as observed through PCA ? Those outlier regions are may or may not distinct for other ways of evaluating genetic variation (pi, Fst, heterozygosity, etc etc)
L209 « instead of selection » inaccurately reflects the last paragraph. Apparently the contribution of linked selection is not necessary to make this structure but can be present but should hasten the separation of populations rather than haplotypes (If I understood correctly Fig S24). Perhaps « reflects primarily reduced local recombination rates ? » (without a necessary contribution of selection)
L271-295 : This matter of variance in regions of low recombination and the impact on genetic statistics (particularly when summarized by windows) has interestingly been highlighted by Booker et al. Perhaps a good reference for this idea.
Booker, TR, Yeaman, S, Whitlock, MC. Variation in recombination rate affects detection of outliers in genome scans under neutrality. Mol Ecol. 2020; 29: 4274–4279. https://doi.org/10.1111/mec.15501
Stevison, LS, McGaugh, SE. It’s time to stop sweeping recombination rate under the genome scan rug. Mol Ecol. 2020; 29: 4249–4253. https://doi.org/10.1111/mec.15690
L305-311 Since those are islands population, may they have a lower effective population size than elsewhere ((or a past bottleneck) ? How does low Ne amplifies the haplotypic structure ?
L364 Simulations from Lotterhos 2019 show precisely which statistics are affected by low recombination and which ones are not. In particular everything affected by LD (PCA, clustering, window-average) are particularly sensitive. Perhaps more nuance is needed here to recall that analyses remain possible !
L443-L444 : No batch effect between the 69 and 110 blackcaps sequenced separately ?
L451 : what is the depth of sequencing ? the realized coverage ?
L5514 : confirmation of inversion and breakpoints : why is that not reflected in the results ?
https://doi.org/10.24072/pci.evolbiol.100711.rev11Reviewed by anonymous reviewer 1, 19 Dec 2023
Ishigohoka et al., examine regions with distinct patterns of genetic variation in the blackcap genome and show that these often correspond to parts of the genome with a low recombination rate. They examine this property with simulations, and discuss the implications of these regions. Overall, this is an interesting paper exploring a seemingly simple but often overlooked concept. It adds to the recent body of literature stressing the importance of considering local recombination rate and the impact it can have on certain common measures.
I do think the paper could go a bit further, as although it shows that these regions exist, the implications of them are still just suggested rather than demonstrated. I have some suggestions for additional analyses that would strengthen the conclusions plus some important clarifications on the methodology. I also found some parts hard to follow and have a few ideas for improving clarity.
The abstract is a nice succinct overview of the paper. The introduction is also well-written and explains concepts well.
The supplementary figures are out of order with when they are mentioned in the text, and some are only mentioned in the methods section. This made it quite confusing to follow some of the analyses.
Line 11: Include Latin name of blackcap here?
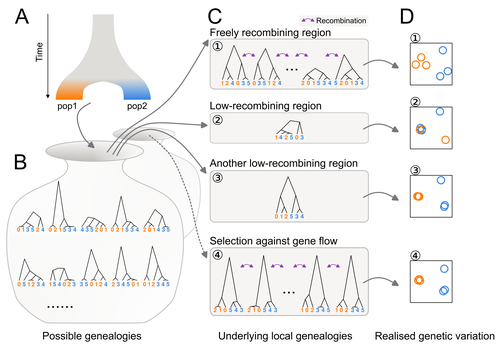
Figure 1- A nice Figure, explaining the concept simply. Clarify that (D) is a PCA in the legend.
Line 41- ‘Usually’ projected onto a few major axes- some analyses use many more axes.
Line 56- Would be nice to have a few more cited examples here.
Line 81- confusing sentence- remove one of the ‘genetic variation’s
Line 94- I couldn’t find how the whole genome PCA was run in Methods - e.g. which software did you use, did you filter for LD and how? Overall, I often find that smartPCA from eigensoft is better than PLINK and could be worth a try here (although it might not make too much of a difference).
Line 98- Include size of window here. Also line 102- include brief definition of how an outlier was classified.
Figure 2A- It looks like there are 2 different Cape Verde populations from the PCA- have you tried splitting these and seeing if there are any population specific low-recombining regions within Cape Verde? Also, for ease of visualisation, 2A could be larger and have size of point correspond to number of individuals.
Figure 2D- I am confused by how many outlying regions overlap with low-recombining ones- do they all? This should be clarified more clearly in the text.
Figure 2F- Label which population has the low recombination rate (can see it is Azores, but would help clarity)
Figure S2- Haplotype-based analyses are often more powerful than genotype-based- is there much difference in results when just using the haplotype version of lostruct?
Methods line 503- How many of these regions were discarded and what proportion? How was similarity to the whole genome PCA judged? Did you try any other thresholds to determine outliers and check how the proportion that looked ‘normal’ changed- e.g. do you need a more conservative threshold? Related to line 115- ‘These clusters did not clearly separate populations’ surely this is because you removed all the ones that did?
Figure S6- This is quite a busy Figure- maybe it would be clearer if the population-specific ones were in a separate figure? Also I’m unsure about some of the categories, e.g. what category is outlier_3_1? Also some of the ‘mixed_individuals’ PCAs seem quite similar in shape to the ‘6 loose clusters’.
Figure 3A- scale and units for the LD is missing (and in the supplementary figures).
Methods line 540- Could do with some more explanation of the permutation test- e.g. how did you calculate overlap, did it have to cover a certain proportion of the length of the outlier region, or 100%, or just any overlap? E.g. Figure S7 chr 30 species-wide outlying region does not seem to have a low recombination rate in med_sw and cont_res and similarly for chromosome 28?
Methods section on Inversion breakpoints- I could not find this section mentioned in the main results section ever? Should be added as a paragraph into results section or removed from paper?
Line 135- mention which simulator used.
Line 144- I wouldn’t say ‘population structure emerged’ completely, especially not when compared to 4D, maybe just some clustering by population? Also in Figure 4, what do the time points correspond to when compared to Figure S17? Also, I am a little confused about the difference between Figure S17 and the top row of Figure S24- why does the latter continue until t=1600, would the results in s17 look similar if the time was increased?
Line 152- Not sure about point of two different scenarios- clarify why they are being compared?
Figure S20BF- what is the Y axis?
Selection section:
Line 192- I could only find PCAs of selection on top of regions with a low recombination rate, none of the effect of selection on the normally recombining regions (e.g. in Figure S24)? Overall this whole section could do with more explanation, it is quite brief and I found it difficult to work out what you have actually shown.
A key (and quite simple) analysis missing from this section would be to run the selection tests (Tajimas D, pi, Fst) on the simulations with a region of reduced recombination rate and no actual selection. If these measures are biased in the outlying regions it would be great evidence for your Discussion/Implication sections (e.g. line 364). I know you show that the low recombining regions in the blackcap genome are often under selection, but surely a big aim of the paper is to show that this could be biased by the regions themselves?
Overall the Discussion needs more references to Figures that show each of the points mentioned (e.g. line 239, which figures show this), and also more citations (e.g. the first line needs citations of which studies it is mentioning). Also I found the first section of the discussion a little long, with the same concepts explained multiple times. The section on recombination landscape as a driver of evolution is interesting, and the implications are well explained.
https://doi.org/10.24072/pci.evolbiol.100711.rev12


