
GÜNTHER Torsten
- Department of Organismal Biology, Uppsala Universitet, Uppsala, Sweden
- Bioinformatics & Computational Biology, Human Evolution, Population Genetics / Genomics
- recommender
Recommendations: 2
Reviews: 0
Recommendations: 2
mtDNA "Nomenclutter" and its Consequences on the Interpretation of Genetic Data
Resolving the clutter of naming “Eve’s” descendants
Recommended by Torsten Günther based on reviews by Nicole Huber, Joshua Daniel Rubin and 1 anonymous reviewerNature is complicated and humans often resort to categorization into simplified groups in order to comprehend and manage complex systems. The human mitochondrial genome and its phylogeny are quite complex. Many of those ~16600 base pairs mutated as humans spread across the planet and the resulting phylogeny can be used to illustrate many different aspects of human history and evolution. But it has too many branches and sub-branches to comprehend, which is why major lineages are considered haplogroups. On the highest level, these haplogroups receive capital letters which are then followed by integers and lowercase letters to designate a more fine-scale structure. This nomenclature even inspired semi-fictional literature, such as Bryan Sykes’ “The Seven Daughters of Eve” [1] from 2001 which includes fictional narratives for each of seven “clan mothers” representing seven major European haplogroups (e.g. Helene representing haplogroup H and Tara representing haplogroup T). But apart from categorizing things, humans also like to make exceptions to rules. For instance, not all haplogroup names consist only of letters and numbers but also special characters. And not everything seems logical or intuitive: the deepest split does not include haplogroup A but the most basal lineage is L0. The main letters also do not represent the same level of the tree structure, Sykes’ Katrine representing haplogroup K should not be considered a “daughter of Eve” but (at best) a granddaughter as K is a sub-haplogroup of U (represented by Ursula). This system and the number of haplogroups have not just reached a point where everything has become incredibly complicated despite supposedly simplifying categories. The inherent arbitrariness can also have serious effects on downstream analysis and the interpretation of results depending on how and on what level the authors of a specific study decide to group their individuals.
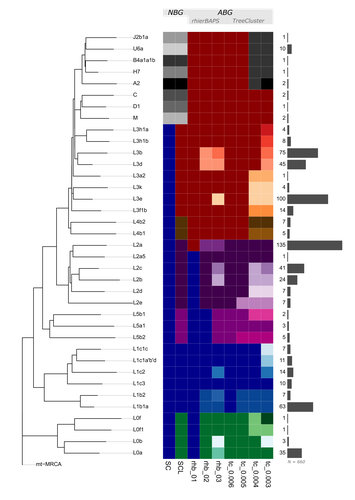
This situation of potential biases introduced through the choice of haplogroup groupings is the motivation for the study by Bajić, Schulmann and Nowick who are using the quite fitting term “nomenclutter” in their title [2]. They are raising an important issue in the inconsistencies introduced by the practice of somewhat arbitrary haplotype groupings which varies across studies and has no common standards in place making comparisons between studies virtually impossible. The study shows that the outcome of certain standard analyses and the interpretation of results are very sensitive to the decision on how to group the different haplotypes. This effect is especially pronounced for populations of African ancestry where the haplotype nomenclature would cut the phylogenetic tree at higher levels and the definition of different lineages is generally more coarse than for other populations.
But the authors go beyond pointing out this issue, they also suggest solutions. Instead of grouping sequences by their haplogroup code, one could use “algorithm-based groupings” based on the sequence similarity itself or cutting the phylogenetic tree at a common level of the hierarchy. The analysis of the authors shows that this reduces potential biases substantially. But even such groupings would not be without the influence of the user or researcher’s choices as different parameters have to be set to define the level at which groupings are conducted. The authors propose a neat solution, lifting this issue to be resolved during future updates of the mitochondrial haplogroup nomenclature and the phylogeny. Ideally, the research community could agree on centrally defined haplogroup grouping levels (called “macro-”, “meso-”, and “micro-haplogroups” by the authors) which would all represent different scales of events in human history (from global, continental to local). Classifications like that could be provided through central databases and the classifications could be added to commonly used tools for that purpose. If everyone used these groupings, studies would be a lot more comparable and more fine-scale investigations could still resort to the sequences and the tree itself to avoid all grouping.
The experts who reviewed the study have all highlighted its importance of pointing at a very relevant issue. It will take a community effort to improve practices and the current status of this research area. This study provides an important first step and it should be in everyone’s interest to resolve the “nomenclutter”.
References
1. Sykes B. (2001) The seven daughters of Eve: the science that reveals our genetic ancestry. 1st American ed. New York: Norton.
2. Bajić V, Schulmann VH, Nowick K. (2024) mtDNA “Nomenclutter” and its Consequences on the Interpretation of Genetic Data. bioRxiv, ver. 3 peer-reviewed and recommended by Peer Community in Evolutionary Biology. https://doi.org/10.1101/2023.11.19.567721
How robust are cross-population signatures of polygenic adaptation in humans?
Be careful when studying selection based on polygenic score overdispersion
Recommended by Torsten Günther based on reviews by Lawrence Uricchio, Mashaal Sohail, Barbara Bitarello and 1 anonymous reviewerThe advent of genome-wide association studies (GWAS) has been a great promise for our understanding of the connection between genotype and phenotype. Today, the NHGRI-EBI GWAS catalog contains 251,401 associations from 4,961 studies (1). This wealth of studies has also generated interest to use the summary statistics beyond the few top hits in order to make predictions for individuals without known phenotype, e.g. to predict polygenic risk scores or to study polygenic selection by comparing different groups. For instance, polygenic selection acting on the most studied polygenic trait, height, has been subject to multiple studies during the past decade (e.g. 2–6). They detected north-south gradients in Europe which were consistent with expectations. However, their GWAS summary statistics were based on the GIANT consortium data set, a meta-analysis of GWAS conducted in different European cohorts (7,8). The availability of large data sets with less stratification such as the UK Biobank (9) has led to a re-evaluation of those results. The nature of the GIANT consortium data set was realized to represent a potential problem for studies of polygenic adaptation which led several of the authors of the original articles to caution against the interpretations of polygenic selection on height (10,11). This was a great example on how the scientific community assessed their own earlier results in a critical way as more data became available. At the same time it left the question whether there is detectable polygenic selection separating populations more open than ever.
Generally, recent years have seen several articles critically assessing the portability of GWAS results and risk score predictions to other populations (12–14). Refoyo-Martínez et al. (15) are now presenting a systematic assessment on the robustness of cross-population signatures of polygenic adaptation in humans. They compiled GWAS results for complex traits which have been studied in more than one cohort and then use allele frequencies from the 1000 Genomes Project data (16) set to detect signals of polygenic score overdispersion. As the source for the allele frequencies is kept the same across all tests, differences between the signals must be caused by the underlying GWAS. The results are concerning as the level of overdispersion largely depends on the choice of GWAS cohort. Cohorts with homogenous ancestries show little to no overdispersion compared to cohorts of mixed ancestries such as meta-analyses. It appears that the meta-analyses fail to fully account for stratification in their data sets.
The authors based most of their analyses on the heavily studied trait height. Additionally, they use educational attainment (measured as the number of school years of an individual) as an example. This choice was due to the potential over- or misinterpretation of results by the media, the general public and by far right hate groups. Such traits are potentially confounded by unaccounted cultural and socio-economic factors. Showing that previous results about polygenic selection on educational attainment are not robust is an important result that needs to be communicated well. This forms a great example for everyone working in human genomics. We need to be aware that our results can sometimes be misinterpreted. And we need to make an effort to write our papers and communicate our results in a way that is honest about the limitations of our research and that prevents the misuse of our results by hate groups.
This article represents an important contribution to the field. It is cruicial to be aware of potential methodological biases and technical artifacts. Future studies of polygenic adaptation need to be cautious with their interpretations of polygenic score overdispersion. A recommendation would be to use GWAS results obtained in homogenous cohorts. But even if different biobank-scale cohorts of homogeneous ancestry are employed, there will always be some remaining risk of unaccounted stratification. These conclusions may seem sobering but they are part of the scientific process. We need additional controls and new, different methods than polygenic score overdispersion for assessing polygenic selection. Last year also saw the presentation of a novel approach using sequence data and GWAS summary statistics to detect directional selection on a polygenic trait (17). This new method appears to be robust to bias stemming from stratification in the GWAS cohort as well as other confounding factors. Such new developments show light at the end of the tunnel for the use of GWAS summary statistics in the study of polygenic adaptation.
References
1. Buniello A, MacArthur JAL, Cerezo M, Harris LW, Hayhurst J, Malangone C, et al. The NHGRI-EBI GWAS Catalog of published genome-wide association studies, targeted arrays and summary statistics 2019. Nucleic Acids Research. 2019 Jan 8;47(D1):D1005–12. doi: https://doi.org/10.1093/nar/gky1120
2. Turchin MC, Chiang CW, Palmer CD, Sankararaman S, Reich D, Hirschhorn JN. Evidence of widespread selection on standing variation in Europe at height-associated SNPs. Nature Genetics. 2012 Sep;44(9):1015–9. doi: https://doi.org/10.1038/ng.2368
3. Berg JJ, Coop G. A Population Genetic Signal of Polygenic Adaptation. PLOS Genetics. 2014 Aug 7;10(8):e1004412. doi: https://doi.org/10.1371/journal.pgen.1004412
4. Robinson MR, Hemani G, Medina-Gomez C, Mezzavilla M, Esko T, Shakhbazov K, et al. Population genetic differentiation of height and body mass index across Europe. Nature Genetics. 2015 Nov;47(11):1357–62. doi: https://doi.org/10.1038/ng.3401
5. Mathieson I, Lazaridis I, Rohland N, Mallick S, Patterson N, Roodenberg SA, et al. Genome-wide patterns of selection in 230 ancient Eurasians. Nature. 2015 Dec;528(7583):499–503. doi: https://doi.org/10.1038/nature16152
6. Racimo F, Berg JJ, Pickrell JK. Detecting polygenic adaptation in admixture graphs. Genetics. 2018. Arp;208(4):1565–1584. doi: https://doi.org/10.1534/genetics.117.300489
7. Lango Allen H, Estrada K, Lettre G, Berndt SI, Weedon MN, Rivadeneira F, et al. Hundreds of variants clustered in genomic loci and biological pathways affect human height. Nature. 2010 Oct;467(7317):832–8. doi: https://doi.org/10.1038/nature09410
8. Wood AR, Esko T, Yang J, Vedantam S, Pers TH, Gustafsson S, et al. Defining the role of common variation in the genomic and biological architecture of adult human height. Nat Genet. 2014 Nov;46(11):1173–86. doi: https://doi.org/10.1038/ng.3097
9. Bycroft C, Freeman C, Petkova D, Band G, Elliott LT, Sharp K, et al. The UK Biobank resource with deep phenotyping and genomic data. Nature. 2018 Oct;562(7726):203–9. doi: https://doi.org/10.1038/s41586-018-0579-z
10. Berg JJ, Harpak A, Sinnott-Armstrong N, Joergensen AM, Mostafavi H, Field Y, et al. Reduced signal for polygenic adaptation of height in UK Biobank. eLife. 2019 Mar 21;8:e39725. doi: https://doi.org/10.7554/eLife.39725
11. Sohail M, Maier RM, Ganna A, Bloemendal A, Martin AR, Turchin MC, et al. Polygenic adaptation on height is overestimated due to uncorrected stratification in genome-wide association studies. eLife. 2019 Mar 21;8:e39702. doi: https://doi.org/10.7554/eLife.39702
12. Martin AR, Kanai M, Kamatani Y, Okada Y, Neale BM, Daly MJ. Clinical use of current polygenic risk scores may exacerbate health disparities. Nature Genetics. 2019 Apr;51(4):584–91. doi: https://doi.org/10.1038/s41588-019-0379-x
13. Bitarello BD, Mathieson I. Polygenic Scores for Height in Admixed Populations. G3: Genes, Genomes, Genetics. 2020 Nov 1;10(11):4027–36. doi: https://doi.org/10.1534/g3.120.401658
14. Uricchio LH, Kitano HC, Gusev A, Zaitlen NA. An evolutionary compass for detecting signals of polygenic selection and mutational bias. Evolution Letters. 2019;3(1):69–79. doi: https://doi.org/10.1002/evl3.97
15. Refoyo-Martínez A, Liu S, Jørgensen AM, Jin X, Albrechtsen A, Martin AR, Racimo F. How robust are cross-population signatures of polygenic adaptation in humans? bioRxiv, 2021, 2020.07.13.200030, version 5 peer-reviewed and recommended by Peer community in Evolutionary Biology. doi: https://doi.org/10.1101/2020.07.13.200030
16. Auton A, Abecasis GR, Altshuler DM, Durbin RM, Abecasis GR, Bentley DR, et al. A global reference for human genetic variation. Nature. 2015 Sep 30;526(7571):68–74. doi: https://doi.org/10.1038/nature15393
17. Stern AJ, Speidel L, Zaitlen NA, Nielsen R. Disentangling selection on genetically correlated polygenic traits using whole-genome genealogies. bioRxiv. 2020 May 8;2020.05.07.083402. doi: https://doi.org/10.1101/2020.05.07.083402