
Phylodynamics of hepatitis C virus reveals transmission dynamics within and between risk groups in Lyon
Quantifying transmission dynamics of acute hepatitis C virus infections in a heterogeneous population using sequence data
Abstract
Recommendation: posted 05 December 2020, validated 11 December 2020
Rasmussen, D. (2020) Phylodynamics of hepatitis C virus reveals transmission dynamics within and between risk groups in Lyon. Peer Community in Evolutionary Biology, 100117. https://doi.org/10.24072/pci.evolbiol.100117
Recommendation
Genomic epidemiology seeks to better understand the transmission dynamics of infectious pathogens using molecular sequence data. Phylodynamic methods have given genomic epidemiology new power to track the transmission dynamics of pathogens by combining phylogenetic analyses with epidemiological modeling. In recent year, applications of phylodynamics to chronic viral infections such as HIV and hepatitis C virus (HVC) have provided some of the best examples of how phylodynamic inference can provide valuable insights into transmission dynamics within and between different subpopulations or risk groups, allowing for more targeted interventions.
However, conducting phylodynamic inference under complex epidemiological models comes with many challenges. In some cases, it is not always straightforward or even possible to perform likelihood-based inference. Structured SIR-type models where infected individuals can belong to different subpopulations provide a classic example. In this case, the model is both nonlinear and has a high-dimensional state space due to tracking different types of hosts. Computing the likelihood of a phylogeny under such a model involves complex numerical integration or data augmentation methods [1]. In these situations, Approximate Bayesian Computation (ABC) provides an attractive alternative, as Bayesian inference can be performed without computing likelihoods as long as one can efficiently simulate data under the model to compare against empirical observations [2].
Previous work has shown how ABC approaches can be applied to fit epidemiological models to phylogenies [3,4]. Danesh et al. [5] further demonstrate the real world merits of ABC by fitting a structured SIR model to HCV data from Lyon, France. Using this model, they infer viral transmission dynamics between “classical” hosts (typically injected drug users) and “new” hosts (typically young MSM) and show that a recent increase in HCV incidence in Lyon is due to considerably higher transmission rates among “new” hosts . This study provides another great example of how phylodynamic analysis can help epidemiologists understand transmission patterns within and between different risk groups and the merits of expanding our toolkit of statistical methods for phylodynamic inference.
References
[1] Rasmussen, D. A., Volz, E. M., and Koelle, K. (2014). Phylodynamic inference for structured epidemiological models. PLoS Comput Biol, 10(4), e1003570. doi: https://doi.org/10.1371/journal.pcbi.1003570
[2] Beaumont, M. A., Zhang, W., and Balding, D. J. (2002). Approximate Bayesian computation in population genetics. Genetics, 162(4), 2025-2035.
[3] Ratmann, O., Donker, G., Meijer, A., Fraser, C., and Koelle, K. (2012). Phylodynamic inference and model assessment with approximate bayesian computation: influenza as a case study. PLoS Comput Biol, 8(12), e1002835. doi: https://doi.org/10.1371/journal.pcbi.1002835
[4] Saulnier, E., Gascuel, O., and Alizon, S. (2017). Inferring epidemiological parameters from phylogenies using regression-ABC: A comparative study. PLoS computational biology, 13(3), e1005416. doi: https://doi.org/10.1371/journal.pcbi.1005416
[5] Danesh, G., Virlogeux, V., Ramière, C., Charre, C., Cotte, L. and Alizon, S. (2020) Quantifying transmission dynamics of acute hepatitis C virus infections in a heterogeneous population using sequence data. bioRxiv, 689158, ver. 5 peer-reviewed and recommended by PCI Evol Biol. doi: https://doi.org/10.1101/689158

The recommender in charge of the evaluation of the article and the reviewers declared that they have no conflict of interest (as defined in the code of conduct of PCI) with the authors or with the content of the article. The authors declared that they comply with the PCI rule of having no financial conflicts of interest in relation to the content of the article.
Evaluation round #4
DOI or URL of the preprint: 10.1101/689158
Version of the preprint: 4
Author's Reply, 25 Nov 2020
Decision by David Rasmussen, posted 17 Nov 2020
Given that the manuscript has already gone through two rounds of review and that the major concerns of the reviewers' from the second round have largely been addressed, I have decided not to send the manuscript out for another round of review. However, there are still a few issues I hope the authors can quickly address before I write my recommendation.
It's stated that the origin of the epidemic in classic hosts is estimated to be in 1957 but it was not possible to estimate when the epidemic in 'new' host started. But doesn't the 1957 estimate reflect the MRCA of all samples, regardless of whether they are "classic" or "new"?
Line 119 goodness-of-fit [test]?
Fig 3. do the summary statistics from the true phylogenies fall within the regions predicted by posterior simulations for individual statistics or just for the PCA on the summary statistics? Would it be more convincing to show the original summary statistics?
Lines 192-194: This is hard to understand, why would adding stages of infection make it "almost impossible to simulate phylogenies"?
Lines 201-203: "Although the multi-type birth-death model is unlikely to be directly applicable... because it links the two epidemics via mutation... whereas in our case the linking here the links is done via transmission events". This is not true. The multi-type birth-death model can handle type changes due to transmission or mutation/migration. Please remove!!
Lines 204-205: "We were unable to conclude anything from this analysis which rises the limitation of the likelihood-based approach for this dataset". In fairness to likelihood-based approaches, it is probably worth noting why the MTBD models implemented in BEAST did not work on this data set. In the response letter, the authors say that this is due to poor mixing. But is this due to difficulties in jointly estimating the phylogeny and evolutionary parameters along with the epidemiological parameters? Does the MCMC converge if the phylogeny is fixed (as was done for ABC)?
Thanks,
David Rasmussen
Evaluation round #3
DOI or URL of the preprint: https://doi.org/10.1101/689158
Version of the preprint: 3
Author's Reply, 12 Nov 2020
Decision by David Rasmussen, posted 21 May 2020
Dear authors,
Both of the original reviewers have now reviewed your revised manuscript. Unfortunately, both still raise substantial concerns that their original concerns were not adequately addressed or deserve more attention.
I strongly agree with the opinion of the reviewers, especially since their criticisms concern the main findings of the paper regarding transmission dynamics in the different risk groups. I would especially urge the authors to carefully address the concerns of the reviewers with respect to:
1) Sampling differences between the "new" and "classic" risk groups and how this impacts the estimated epidemic growth rates in each group. 2) The comments from Reviewer #2 about the priors on the ratio of the transmission rates between risk groups. I agree with the reviewer here that that the priors should give symmetric or equal prior probability to either risk group having a higher transmission rate.
Reviewed by Chris Wymant, 21 May 2020
Apologies to the authors for my delayed response.
This previous substantive concern has not been addressed: "The main conclusion of the paper is that the epidemic in new hosts is growing faster than that in classical hosts, however the confidence with which this conclusion can be made is not stated. The doubling time in classical hosts since 1997 is estimated to be 0.58 - 10.13 years, and the doubling time in new hosts 0 - 3.51 years. The relevant quantity for the conclusion is the posterior for the ratio of these two parameters. The authors do present a ratio comparing the two hosts with regards to the reproduction number, and find that the confidence intervals do not exclude 1; if the same is true of the doubling time, which seems plausible given the similar parameter dependencies of R_0 and doubling time, the main conclusion is not supported. The same point applies to the other host parameters inferred to be different: assortativity and recovery/removal rate. The parameters themselves need not be redefined, but the posteriors of their ratios should be examined to support claims of differences" (and the precision with which these differences have been measured). This applies both to the difference between the two host types, and also to the difference in the effective reproduction number before and after the third generation tests, where a difference is currently presented despite strongly overlapping confidence intervals in the two separate values. If the ratio of doubling times does indeed have a credibility interval excluding 1, I would suggest reporting it as 10 [x-y] times smaller for new hosts instead of an order of magnitude lower, to also communicate the precision of the estimate.
I am uncertain, but think my concern about differences in sampling has not been addressed. My concern was that higher sampling in the new group than in the classical group might lead to the data observed, and to the resulting conclusion, even if there were no difference in transmission dynamics in the two groups. I think the authors' reply can be summarised as saying that if the new group was under-sampled, spread there would be even faster than currently estimated. But the same is also true in the classical group, and if it were true there to a greater extent - i.e. lower sampling there - then the true difference in transmission dynamics between the groups would be less than that estimated here. In the absence of any information of the true underlying population sizes, the most defensible assumption on sampling might be that equal proportions of both populations end up diagnosed, and not that equal proportions of both populations end up included in the present study, given that the classical group seems to have been deliberately downsampled and by a known factor.
Unless I have misunderstood, the authors' choice of the prior Unif(1, 10) for the parameter nu means it was impossible to come to any conclusion other than a greater transmission rate for new hosts. The prior for nu should have equal weight above and below 1 if we are to learn how the data inform the ratio of transmission rates; here it has zero weight below 1. I think that treating the two hosts equally a priori (i.e. imposing a host-type interchangeability symmetry) implies that the prior for log(nu) should be symmetrical about 0. Thank you for the suggestion. We now run the same ABC analyses with a prior of \nu in Unif(0,10) to include both hypotheses. Re-articulating my previous concern, this was that 100% of the prior probability mass was for nu greater than 1, when it should be 50% if the prior is to be uninformative of differences between the host types. In modifying the prior from Unif(1,10) to Unif(0,10), it is now the case that 90% of the prior probability mass is greater than 1; this is still far from 50%. More specifically, for parameter priors to be agnostic about the hosts, they should be unchanged by relabelling the two host types new <-> classical. For parameters describing a multiplicative difference, the prior p should be such that it is equally likely that the one group's parameter is x times larger as it that the other group's parameter is x larger. In other words p should satisfy int{1/a}^{1/b} p(x) dx = int{b}^{a} p(x) dx for any a and b. Equivalently, probability mass should be symmetric about zero on a logarithmic scale for x, i.e. F(log(x)) dlog(x) = F(log(x))/x dx for any symmetric function F. The simplest example is F=1, i.e. a prior of 1/x, truncated above a point L and below a point 1/L to give a proper prior. Given the previously plotted shape of the posterior for nu, I am confident that the authors' qualitative result will be unchanged with this more appropriate prior. However the paper's conclusion would be considerably more persuasive if it arises from an uninformative prior than from a prior geared 90% towards that conclusion. Also judging by the posteriors in Figure 2, the aforementioned truncation point L for the parameter nu looks like it ought to be greater than 10; similarly, priors allowing for higher values of gamma2 and R01^{t2} seem justified given the data (posteriors squashing to the prior boundary).
Minor suggestions:
For a number of points where I requested clarification, this was provided in the response without indicating whether it was also added to the manuscript. For the authors to check and consider, to taste.
With the shift in nomenclature from basic reproductive number to effective reproductive number, it would be appropriate to drop the subscript 0 in R_0.
146 onwards: I don't understand the hypothesis being tested here. I think it is that previously the epidemic consisted only of people who were diagnosed a long time after infection, but more recently there is a separate epidemic of people who were diagnosed shortly after infection. This only makes sense to me if diagnosis time is merely a proxy for another characteristic that is causal for difference in dynamics. Here, we wanted to validate the fact that the differences in the structure and the labels in the phylogeny are not due to the infection phase (acute vs. chronic), but rather to the epidemiological profile (classical hosts vs new hosts). This is because new/MSM hosts are all detected during acute infections. I think I now understand this: in the alternative model, nu is the difference in infectiousness for the same person in acute and chronic phases, not for two different people who tend to be diagnosed in different stages, correct? Including the ODE for this model in the supplementary material would clarify this.
80: "posterior to 1997" -> "after 1997"
108: "To better apprehend" -> "To better understand" (or similar)
113-116: consistent time units throughout would aid comparison of these numbers.
188-191: I suggest moving this sentence to the introduction. Specifying precisely how the two host groups were defined is helpful for following the rest of the paper (c.f. our earlier confusion).
261 (just before): I think the numerator should be (clarified to) "number of descendant leaves labelled Y"
Figure 2: I suggest spreading these plots over two rows, as the horizontal squashing makes them hard to read. Also using the same x axis scale for the two reproductive numbers would aid comparison.
Best wishes, Chris Wymant
https://doi.org/10.24072/pci.evolbiol.100217.rev31Reviewed by Louis DuPlessis, 10 May 2020
The authors have improved the manuscript and addressed some of the comments from the previous round of reviews, but there are still a few issues with the manuscript.
Major comments
How representative are the TMRCAs of the 10 replicate trees of the posterior distribution estimated for the TMRCA is BEAST2? This should be shown. It is of necessity a very small number of replicates (10 samples are usually not enough to sufficiently represent a distribution), and if they are all very close to each other, then this doesn't address the underlying issue - that the target tree's TMRCA distribution has an HPD interval of ~35 years, which is reduced to a single median estimate in the regression-ABC analysis.
In the previous review I suggested that including a background set of global HCV genotype 1a sequences sampled over a larger time period will help with reducing the TMRCA uncertainty (adding more sequences over a longer time period means that internal node height estimates are more accurate). The target tree can then be pruned from this bigger tree. Alternatively, I would have to be convinced that the 10 replicates are representative of the posterior TMRCA distribution of the BEAST2 analysis (point 1).
Line 140: I agree that if new hosts are undersampled then the analysis is conservative. However, it seems more likely to me that new hosts are oversampled. If the sampling proportion is much higher for new hosts, and high assortativity holds, then we would expect sequences from new hosts to coalesce faster, even if both populations are growing at the same rate (since the population size of new hosts would be smaller). I think the phylogeny is consistent with both the interpretation in the text (equal sampling rates and different growth rates) and with very different sampling rates and equal growth rates.
Minor comments
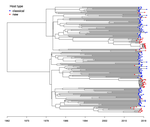
The statement about BEAST2 being used to root a PhyML tree is still in the legend to Figure 1.
tf in the methods should be t3
Even with a fixed strict clock the target tree TMRCA is still very uncertain with an HPD of ~35 years (very much the same as when co-estimating both parameters). Could the authors please double-check that? Since the TMRCA and the clock-rate usually have a very strong negative correlation to each other, fixing one should also restrict the other. This could mean that the sequences are not very informative about the branch lengths (in substitutions/site) or topology. Perhaps the authors could check if very few nodes in the MCC tree have a high posterior probability (or alternatively look at bootstrap scores in the ML tree).
In the coalescent simulation, are branching times drawn from exactly those transmission events in the simulated epidemiological trajectories (step one in the simulation procedure) or are they simply drawn from the probability of two lineages to coalesce given the population sizes from the simulated trajectories?
As explained by the editor, a multi-type birth death model is sufficient to model the scenario. However, the revised manuscript still contains a paragraph stating that birth death models are not applicable. Two types of state-change events can be modelled in BEAST2 with BDMM, the default is indeed mutation based, but in the other states change on a transmission event (exactly at branching times).
Evaluation round #2
DOI or URL of the preprint: 10.1101/689158
Version of the preprint: 2
Author's Reply, 13 Apr 2020
Dear David, dear PCI,
we apologize for the delay in replying, which is parlty due to the COVID-19 havoc.
We took the time to discuss this with Gonché today and I realised that the reports from the reviewers are those from round 1 and there is only your comment that differs from the first round.
About your comment, we do not understand the example you take to illustrate the lack of changes made. Indeed you write: "For example, the prior on nu in Figure 2 is still constrained to be greater than one, so it is technically impossible for the new hosts to have an estimated transmission rate less than classic hosts."
As explained in our response file and as you can see in Figure 2 and Table 1 from the revised version of the manuscript, the prior now starts in 0.
We do think we did take into account most of the reviewers' suggestions. You mention the definition of classical vs. new hosts but it does seem that we're addressing this in the revised version. The main thing we were not able to do was to run Denise Kuenhert's Beast package but this was not for lack of trying (we even sollicited Tanja Stadler's group and still the MCMC chain would not start). At some point we do not think we should be held responsible for the applicability of others' softwares...
If you have anything very specific in mind about the changes we should make, please let us know.
Otherwise we would appreciate if the evaluation could go forward...
We thank you in advance for your time.
Best regards,
- Samuel
Decision by David Rasmussen, posted 13 Apr 2020
Dear authors,
I have read over your revised manuscript on biorxiv and I would like to send it back out for review. However, I noticed that several very helpful and productive comments made by the reviewers who are very knowledge experts in this field were not addressed. For example, the prior on nu in Figure 2 is still constrained to be greater than one, so it is technically impossible for the new hosts to have an estimated transmission rate less than classic hosts. This is however just one example, it appears that several other helpful suggestions made by the reviewers were also ignored.
To make the most of the reviewers time, please submit another version either with further edits or a response letter detailing why you have not followed the recommendations of the reviewers.
-David
Evaluation round #1
DOI or URL of the preprint: 10.1101/689158
Version of the preprint: 1
Author's Reply, 26 Feb 2020
Decision by David Rasmussen, posted 13 Sep 2019
Dear authors,
Your preprint has been reviewed by two experts with substantial experience in the field of viral phylodynamics. Both the reviewers and I appreciate that identifying populations and risk factors driving the transmission dynamics of HCV and other chronic infections is an extremely important topic relevant to public health. However, both reviewers raise substantial concerns about the analysis that I believe need to be addressed before I can offer a recommendation. In particular, one reviewer raises serious concerns about the quality of the phylogenetic reconstruction and therefore the conclusions that can be drawn from a single ML tree. The other reviewer points out that some of the main conclusions, such as in which risk group the epidemic is growing faster in, are not clearly supported by the data and may in fact be largely influenced by the author's choice of priors (i.e. no prior support is given to the alternative scenario that the epidemic is growing faster in 'classic' hosts). Both reviewers also point out that the model needs to be more clearly defined, including how individuals are classified into risk groups, and I would suggest maybe briefly describing the model and how different host types are defined before the results section in your revision.
Many of the reviewers concerns could be addressed by performing a second analysis using the multi-type birth death models implemented in the BDMM package in BEAST 2. The authors make a point in the Discussion that birth-death models might not be applicable here because the two epidemics are linked by transmission rather than mutation, but the 'types' assigned to lineages can either represent the type of the host (as in new or classical) or the type of pathogen (mutant or non mutant) under multi-type birth-death models. Performing this additional analysis with BDMM would allow the authors to compare their ABC methods with more traditional likelihood-based phylodynamic methods, which would lend trust to authors conclusions especially since ABC methods are still in their infancy and many readers might be interested in this comparison. Furthermore, fitting a multi-type birth-death model in BEAST would allow for joint inference of the phylogeny with the epidemic parameters, addressing the first reviewer's point about tree uncertainty.
In addition to the reviewers many thoughtful comments, I would add the following points as well:
Line 64: "date of the second epidemic" -- what is this second epidemic?
Line 54: "The width of the posterior distribution indicates our ability to infer a parameter" -- This is not necessarily true... the width of the posterior could be very wide with very long tails, but most of the posterior density could still be centered around a narrow range of values.
Bayesian should be capitalized throughout.
Could the authors comment on why was the infectious period inferred to be so short for "new" hosts?
David Rasmussen
Additional requirements of the managing board:
Please ignore this message if you already took there requirements into consideration.
As indicated in the 'How does it work?’ section and in the code of conduct, please make sure that:
-Data are available to readers, either in the text or through an open data repository such as Zenodo (free), Dryad (to pay) or some other institutional repository. Data must be reusable, thus metadata or accompanying text must carefully describe the data.
-Details on quantitative analyses (e.g., data treatment and statistical scripts in R, bioinformatic pipeline scripts, etc.) and details concerning simulations (scripts, codes) are available to readers in the text, as appendices, or through an open data repository, such as Zenodo, Dryad or some other institutional repository. The scripts or codes must be carefully described so that they can be reused.
-Details on experimental procedures are available to readers in the text or as appendices.
-Authors have no financial conflict of interest relating to the article. The article must contain a "Conflict of interest disclosure" paragraph before the reference section containing this sentence: "The authors of this preprint declare that they have no financial conflict of interest with the content of this article." If appropriate, this disclosure may be completed by a sentence indicating that some of the authors are PCI recommenders: “XXX is one of the PCI XXX recommenders.”
Reviewed by Chris Wymant, 07 Aug 2019
Reviewed by Louis DuPlessis, 11 Sep 2019
Summary
This manuscript investigates the roles of different populations in sustaining ongoing HCV epidemics in France using 213 newly sequenced HCV genomes and an ABC phylodynamics approach to infer epidemiological parameters. In particular the authors examine the difference between so-called classical hosts, who spread the disease through needle-sharing and new hosts that spread HCV through sexual transmission.
I found some disconnect between the populations described in the introduction and the ones actually used in the analysis. This may just be a small misunderstanding on my part, but to ensure that everyone is on the same page I wrote down a detailed description of my understanding below.
The weak point of the ABC approach is that all parameter estimates (and some of the model priors) are conditioned on a single independently estimated tree. If this tree is poorly estimated, parameter estimates will likely be biased. From what is presented in the manuscript I am not convinced that the dataset used here has sufficient temporal resolution for the reconstructed tree (in this case the MCC tree from a BEAST analysis) to be correlated to the transmission tree. I also expand on this point below.
I think the application is of high interest and should definitely be investigated. The ABC method is interesting as an alternative to the usual Bayesian phylodynamics approach, since it allows using (almost) arbitrarily complex epidemiological models without the need to calculate the probability of observing a tree under the model. However, it also comes with its own set of limitations, and in this case I think the dataset may not be suitable. In the comments below I offer a few suggestions for addressing this issue. As things stand I trust the estimates of the ABC method, given the tree the authors used, but I don't trust that tree and so I would not extrapolate the results to the real world.
Major comments
The different populations of interest and study populations should be presented more clearly.
- As I understand it, there are 4 populations of interest:
- HIV-positive PWID
- HIV-positive MSM
- HIV-negative MSM using PrEP
- HIV-negative MSM not using PrEP
(There is some degree of overlap between populations 1 and 2 and population 4 is mostly unsampled).
By the definition in the introduction classical hosts predominantly stem from population 1 and new hosts from the remaining 3 populations, where transmission is sexual.
In the genetic dataset new hosts are represented by all MSM patients (which presumably includes representatives from populations 2,3 and 4). Classical hosts are represented by non-MSM, HIV-negative male patients.
Did I understand all of the populations correctly?
The relationship between classical hosts in the genetic dataset and HIV-positive PWID (population 1) is not clear to me. Are they also PWID? Do you have any information about the main mode of transmission in this population or a reason to believe that it is through needle-sharing?
- As I understand it, there are 4 populations of interest:
The main informative events for the ABC approach are the branching times in the tree. Since the ABC approach conditions on a single tree, it is extremely important that the timing of the tree is accurate. Judging from the TMRCA estimate, which has an HPD from 1962 to 1997, I think it's likely that many of the other internal nodes have a similar range of uncertainty, which is ignored when conditioning on the MCC tree. The result is that estimates that rely on the timescale (reproduction numbers, infectious periods, origin times) are likely to be biased. As an example, the authors placed a uniform prior from 1962 to 1997 on t0. However, by conditioning on the MCC tree, the upper bound of this prior implicitly becomes 1981, which explains why no t0 estimates are larger than 1981. In addition, the authors divided the tree into 3 epochs, with different reproduction numbers. However, it is likely that the uncertainty associated with internal nodes stretch across multiple epochs, which call into question the estimates reported here. (If the procedure was repeated with different trees drawn from the set of posterior trees parameter estimates would be different).
At the least the authors should test for a temporal signal in the data. Since sequences are only sampled over 4 years and HCV has highly variable within-host evolutionary rates, it is possible that there isn't a good clock signal. The authors should also provide more details of the model used for the BEAST analysis, as using a poorly fitting tree prior can lead to inferring biased branching times.
Even if there is a temporal signal in the data it may still be impossible to obtain accurate estimates of the branching times, since the sampling period is small compared to the tree height. In this case, the analysis could be performed with a fixed or highy constrained clock rate (based on previous analyses of HCV genotype 1a). Alternatively, more genotype 1a sequences from Europe (spanning a bigger sampling period) could be downloaded from Genbank. This will allow internal nodes to be more accurately estimated. If the Lyon sequences form a monophyletic clade, this clade could be pruned from the tree and used for further analyses by the ABC approach.
I believe the authors are estimating the effective reproduction number (Re), not the basic reproduction number (R0).
Figure 1 should be improved. It is impossible to see the structure of the tree close to the present or to read the tip labels.
Line 213: \nu is not simply a factor of the [mean] number of partners of classical (I1) and new (I2) hosts. The modes of transmission differ between I1 and I2 (blood vs. sexual) and there is also presumably a difference in the per-act likelihood of transmission between the different modes of transmission.
In addition, \nu is constrained to always be greater than or equal to 1. This appears to be backed up by the data, but is not necessarily always the case. Why is it a priori assumed that there is a higher transmission rate between new hosts (MSM) than between classical hosts (PWID)?
Minor comments
What is meant by the phylogeny was estimated in PhyML and then rooted using BEAST? Does this mean that you performed a BEAST analysis on the sequence data using the maximum-likelihood tree as a starting tree?
Line 57: I don't know the shape of the posterior distribution for the TMRCA, but regardless of how peaked it is, I wouldn't place much confidence on the TMRCA being in the early 1980s when the HPD interval stretches from 1962 to 1997.
Do the authors use the epidemiological data from the Dat'AIDS cohort anywhere? Is there a relation between the cohort and the sequences sampled in Lyon?
The AIC is not a good method for Bayesian model comparison. To choose between a strict and relaxed clock it makes more sense to check if the HPD for the coefficient of variation (for the relaxed clock model) excludes 0.
Line 242: Please provide more details about how coalescent trees are drawn from the simulated trajectories and sampling dates (are the sampling dates fixed to the truth or are they also from the model?).
Using the word "cluster" for heterogeneous and homogeneous clades is misleading as cluster has a specific interpretation in an epidemiological setting. Clade is a better term to use here.
Heterogeneous clusters (should be clade) of type Y are defined as clades where more than 70% of leaves are of type Y (and includes clades where all but one leaf are of type Y). What about very heterogeneous clades, where type Y makes up between 50 and 70% of leaves? Are these clades completely ignored? In addition, did you use a greedy algorithm to find the biggest possible clades or do you have nested homogeneous and heterogeneous clades? (the same branch can appear in multiple clades).


