
Beyond the standard coalescent: demographic inference with complete genomes and graph neural networks under the beta coalescent
 based on reviews by 2 anonymous reviewers
Simultaneous Inference of Past Demography and Selection from the Ancestral Recombination Graph under the Beta Coalescent
Abstract
Recommendation: posted 04 March 2024, validated 04 March 2024
Dutheil, J. (2024) Beyond the standard coalescent: demographic inference with complete genomes and graph neural networks under the beta coalescent. Peer Community in Evolutionary Biology, 100699. https://doi.org/10.24072/pci.evolbiol.100699
Recommendation
Modelling the evolution of complete genome sequences in populations requires accounting for the recombination process, as a single tree can no longer describe the underlying genealogy. The sequentially Markov coalescent (SMC, McVean and Cardin 2005; Marjoram and Wall 2006) approximates the standard coalescent with recombination process and permits estimating population genetic parameters (e.g., population sizes, recombination rates) using population genomic datasets. As such datasets become available for an increasing number of species, more fine-tuned models are needed to encompass the diversity of life cycles of organisms beyond the model species on which most methods have been benchmarked.
The work by Korfmann et al. (Korfmann et al. 2024) represents a significant step forward as it accounts for multiple mergers in SMC models. Multiple merger models account for simultaneous coalescence events so that more than two lineages find a common ancestor in a given generation. This feature is not allowed in standard coalescent models and may result from selection or skewed offspring distributions, conditions likely met by a broad range of species, particularly microbial.
Yet, this work goes beyond extending the SMC, as it introduces several methodological innovations. The "classical" SMC-based inference approaches rely on hidden Markov models to compute the likelihood of the data while efficiently integrating over the possible ancestral recombination graphs (ARG). Following other recent works (e.g. Gattepaille et al. 2016), Korfmann et al. propose to separate the ARG inference from model parameter estimation under maximum likelihood (ML). They introduce a procedure where the ARG is first reconstructed from the data and then taken as input in the model fitting step. While this approach does not permit accounting for the uncertainty in the ARG reconstruction (which is typically large), it potentially allows for the extraction of more information from the ARG, such as the occurrence of multiple merging events. Going away from maximum likelihood inference, the authors trained a graph neural network (GNN) on simulated ARGs, introducing a new, flexible way to estimate population genomic parameters.
The authors used simulations under a beta-coalescent model with diverse demographic scenarios and showed that the ML and GNN approaches introduced can reliably recover the simulated parameter values. They further show that when the true ARG is given as input, the GNN outperforms the ML approach, demonstrating its promising power as ARG reconstruction methods improve. In particular, they showed that trained GNNs can disentangle the effects of selective sweeps and skewed offspring distributions while inferring past population size changes.
This work paves the way for new, exciting applications, though many questions must be answered. How frequent are multiple mergers? As the authors showed that these events "erase" the record of past demographic events, how many genomes are needed to conduct reliable inference, and can the methods computationally cope with the resulting (potentially large) amounts of required data? This is particularly intriguing as micro-organisms, prone to strong selection and skewed offspring distributions, also tend to carry smaller genomes.
References
Gattepaille L, Günther T, Jakobsson M. 2016. Inferring Past Effective Population Size from Distributions of Coalescent Times. Genetics 204:1191-1206.
https://doi.org/10.1534/genetics.115.185058
Korfmann K, Sellinger T, Freund F, Fumagalli M, Tellier A. 2024. Simultaneous Inference of Past Demography and Selection from the Ancestral Recombination Graph under the Beta Coalescent. bioRxiv, 2022.09.28.508873. ver. 5 peer-reviewed and recommended by Peer Community in Evolutionary Biology. https://doi.org/10.1101/2022.09.28.508873
Marjoram P, Wall JD. 2006. Fast "coalescent" simulation. BMC Genet. 7:16.
https://doi.org/10.1186/1471-2156-7-16
McVean GAT, Cardin NJ. 2005. Approximating the coalescent with recombination. Philos. Trans. R. Soc. Lond. B. Biol. Sci. 360:1387-1393.
https://doi.org/10.1098/rstb.2005.1673

The recommender in charge of the evaluation of the article and the reviewers declared that they have no conflict of interest (as defined in the code of conduct of PCI) with the authors or with the content of the article. The authors declared that they comply with the PCI rule of having no financial conflicts of interest in relation to the content of the article.
This work was supported by the BMBF-funded de.NBI Cloud within the German Network for Bioinformatics Infrastructure (de.NBI) (031A532B, 031A533A, 031A533B, 031A534A, 031A535A, 031A537A, 031A537B, 031A537C, 031A537D, 031A538A). KK is supported by a grant from the Deutsche Forschungsgemeinschaft (DFG) through the TUM International Graduate School of Science and Engineering (IGSSE), GSC 81, within the project GENOMIE QADOP. TS is supported by the Austrian Science Fund (project no. TAI 151-B). AT acknowledges funding from the DFG grant TE809/1-4 (project 254587930) and TE809/7-1 (project 317616126). FF and AT acknowledge funding from the DFG Priority Program SPP1590 on "Probabilistic Structures in Evolution". MF and AT acknowledge the support from the Imperial College - TUM Partnership award.
Evaluation round #2
DOI or URL of the preprint: https://doi.org/10.1101/2022.09.28.508873
Version of the preprint: 4
Author's Reply, 27 Feb 2024
Dear Recommender,
Please find attached our revised manuscript entitled “Simultaneous Inference of Past Demography and Selection from the Ancestral Recombination Graph under the Beta Coalescent” by, Kevin Korfmann, Thibaut Sellinger, Fabian Freund, Matteo Fumagalli and Aurélien Tellier.
First we would like to both reviewers for reading and appreciating the revised version of the manuscript. We understood that the main and last remaining problem was the scaling discrepancy between the kingman coalescent and the implementation of the beta coalescent in msprime.
We found ourselves puzzled at first as the implementation of msprime was beyond the scope of our study but we however understood the concern and modified the manuscript to improve the clarity behind the implementation of the Beta coalescent in msprime.
Many thanks in advance,
On behalf of the authors,
Kevin Korfmann & Thibaut Sellinger
Revision round #2
Decision for round #2 : Revision needed
Revision needed
Dear authors,
I have received feedback from the two reviewers, and you will see that they are generally satisfied with your revision. There is one remaining point from reviewer 2 (why a beta-coalescent with alpha=2 does not exactly converge to a standard coalescent) that needs further clarification. As also pointed out by reviewer 1, the beta-coalescent might not be as widespread knowledge as more classical models; therefore, I believe it is important to make its presentation as clear as possible. If you would be able to address this last point, I would then recommend the manuscript for PCi Evol Biol.
Best regards,
Julien Dutheil.
Reviewer 1 :
The preprint has improved significantly from the previous version in the presentation and communication. I would like to acknowledge the authors for addressing all major and most specific comments, evident in the main text and the inclusion of new figures. Regarding one of the major comments, it was exciting to see the newly added results of GNNcoal trained with true or inferred genealogies. While I maintain my concern about the reader-friendliness of presenting some data in tables instead of in figures, I recognize that this is not a critique of the scientific content. This matter, therefore, can be appropriately discussed in the correspondence between the authors and the recommender. Finally, I would like to congratulate the authors on the revised version of the preprint and I thank the recommender for inviting me to review this exciting manuscript.
Reply: We thank Reviewer 1 for their comments and their appreciation of the revised version of the manuscript.
Reviewer 2 :
“Most importantly, I do not understand, why the Beta-coalescent is not exactly transitioning to the Kingman coalescent for α = 2.”
Reply: We would like to thank the reviewer for the detailed inspection of the underlying model. The first point we would like to make is that the scaling indeed plays an important part as is evident in Figure 2 and recognized by the reviewer. This figure describes the evaluation of PSMC/MSMC on the msprime implementation of the Beta coalescent. Likewise both SMBC and GNNcoal have been evaluated on the msprime version of the Beta coalescent and any scalings introduced by msprime are either directly mathematically transferred in SMBC or learned implicitly through training on simulations by GNNcoal.
To find justification for the reason of implementing the scaling we reached out to Dr Jere Koskela, Reader in Statistics at Newcastle, who is involved with the implementation of the respective parts in msprime. In his reply he confirms that the Beta coalescent and its coalescent rates in the limit as alpha goes to 2 (and plugging it in the Delta-distribution), we obtain the Kingman coalescent. However, this view lacks any relation or notion of time scales, which is where the issue lies. The msprime paper indeed implements the Galton-Watson-process of the Schweinsberg, 2003 paper, which adds a notion of a time scale, whose scaling can be found either in the msprime documentation and literature mentioned below. Furthermore Dr Koskela, also highlights a discontinuous jump in timescale as alpha->2 and actually is equal to 2.
For completeness we attach the relevant part of Dr Koskelas’ kind reply in the following: “[...] If I just take a Beta-coalescent as an abstract mathematical object and send α to 2, I get the Kingman coalescent with no further caveats or complications (indeed, there is no notion of a timescale). If I specify that I'm working with the pre-limiting sequence of supercritical Galton-Watson-type population models in Schweinsberg's paper, then there is a notion of timescale and sending α to 2 affects it. Setting α >= 2 gives a timescale of C(α)N generations for a constant C(α) > 0 which depends on α but not N (Schweinsberg's Lemma 6), while 1 < α < 2 yields the timescale in the msprime BetaCoalescent documentation (Schweinsberg's Lemma 13). In fact, the 1 < α < 2 timescale collapses to zero as α -> 2 [...], so there is a discontinuous jump in the timescale from α -> 2 to α = 2, i.e. the limit and the timescale do not commute. [...]”
What does that mean for SMBC and GNNcoal?
As stated earlier, any time scales implemented in msprime are also inherited by our models (e.g. α is upper bounder by 1.99 in SMBC). Due to the discontinuity when moving from Beta coalescent to Kingman coalescent, studies are required to carefully evaluate the expected strength of the underlying sweepstakes of the model organism and choose the appropriate neutral model. This is especially crucial since the phase from α>1.9 up to 1.99 where msprime suffers from numerical instability issues, which are actively being addressed and improved currently by Dr Koskela and the authors of msprime.
Second, the “standard” SMC-based methods do indeed assume a Wright-Fisher model scaling (N generations, as the coalescence probability =1/N exactly), so they will derive a different timescale even when alpha is very close to 2 (see below reply to question 3).
Schweinsberg paper: https://www.sciencedirect.com/science/article/pii/S0304414903000280
Doesn’t this show that there is some scaling problem of the mutation rates in your simulation?
Reply: We checked our simulation scripts and our mutation rates are in line with how our msprime was designed. As explained above the discrepancy originates from the simulator implementation and not by our use of it. We have now introduced one sentence in the introduction (Line 61-67) and in the method section to clarify the issue with msprime (Line 256-261).
Minor points:
1.) The explicit formulas for the scaling-factor are incomplete: In the formula for the so-called ”scaling constant” on Line 64, there appears a β, which has not been introduced or defined as a parameter.
Reply: We apologize for this confusion, this beta stands for the Beta function. We corrected the manuscript.
2.) The quotations after these formulas are unhelpful, at least to me. I took a look at all three papers (refs. 8, 55 and 56), and while I admit I didn’t read them in all detail, I could not really find these formulas. Perhaps these formulas could be derived for the reader (with references) in a short Supplementary Chapter or a methods paragraph. They can then be taken out of the text in lines 62-64, actually, where they are a bit overwhelming I think
Reply: Once again we apologize for the confusion. The formulas can be explicitly found in the msprime documentation and we have therefore added the reference to the msprime manuscript where the beta coalescent was introduced (2022 in Genetics) as well as the article from Schweinsberg in 2003 where the events rates are derived. We also added a short description in our methods as well as the documentation of msprime in the data availability section to make it easier for the reader to find information specific to msprime.
3.) The authors’ response about my critique of their figure 2 is partly convincing. I get that you want to make the point that indeed the population size inference gets wrong if the assumptions break down. But, coming back to my main point above, this point only comes across if you actually show that the discrepancy between expectation and fit actually vanishes for α → 2. I find it hard to believe that for α = 1.9, the violation of the Kingman-coalescent assumption is already so stark that the population size is mis-estimated by a factor 100, which is what I see in Figure 2a. To repeat myself: I think there is something wrong with that. What I would have expected from that figure is a fit which looks very good for, say, α = 1.99, perhaps marginally worse for α = 1.9, and then perhaps increasingly bad for lower values. Instead, what I see in your Figure 2 is a terrible fit in all four cases, with a discrepancy ranging from a factor 100 to 1000
Reply: We understand your point and hope to have addressed the scaling issue above.
However concerning the underlying point about scaling discrepancy due to biological factors (and not implementation) we agree with you. If the inferred alpha is greater than 1.9 (or even 1.8) we would simply assume the underlying model to be a Kingman coalescent and use eSMC2 (or msmc2). That is why the user is free to choose the scaling with SMBC (the Kingman coalescent one or the beta coalescent one resulting from the implementation of msprime), the output shape will not change, just its position on the y and x axis. The output from SMBC can also be scaled according to the user preference if they wish to introduce knowledge that SMBC does not have.
We now clarify the issue in the method part of the manuscript using the msprime manual as reference and beginning of the results part (Line 328-355).
Minor point: In Line 62 there is a typo, I think. It says Beta(2α,α), but I think it should be Beta(2 −α,α)
Reply: Thank you for spotting this issue. The minus was in the .tex but was not displayed in the pdf. We now fixed it.
Decision by Julien Yann Dutheil, posted 07 Feb 2024, validated 07 Feb 2024
Dear authors,
I have received feedback from the two reviewers, and you will see that they are generally satisfied with your revision. There is one remaining point from reviewer 2 (why a beta-coalescent with alpha=2 does not exactly converge to a standard coalescent) that needs further clarification. As also pointed out by reviewer 1, the beta-coalescent might not be as widespread knowledge as more classical models; therefore, I believe it is important to make its presentation as clear as possible. If you would be able to address this last point, I would then recommend the manuscript for PCi Evol Biol.
Best regards,
Julien Dutheil.
Reviewed by anonymous reviewer 1, 30 Jan 2024
The preprint has improved significantly from the previous version in the presentation and communication.
I would like to acknowledge the authors for addressing all major and most specific comments, evident in the main text and the inclusion of new figures.
Regarding one of the major comments, it was exciting to see the newly added results of GNNcoal trained with true or inferred genealogies.
While I maintain my concern about the reader-friendliness of presenting some data in tables instead of in fugures, I recognize that this is not a critique of the scientific content.
This matter, therefore, can be appropriately discussed in the correspondence between the authors and the recommender.
Finally, I would like to congratulate the authors on the revised version of the preprint and I thank the recommender for inviting me to review this exciting manuscript.
https://doi.org/10.24072/pci.evolbiol.100699.rev21
Reviewed by anonymous reviewer 2, 07 Feb 2024
Evaluation round #1
DOI or URL of the preprint: https://doi.org/10.1101/2022.09.28.508873
Version of the preprint: 3
Author's Reply, 04 Jan 2024
Decision by Julien Yann Dutheil, posted 03 Oct 2023, validated 04 Oct 2023
This manuscript by Korfmann and collaborators reports extensive developments of new genomic inference methods based on the beta-coalescent. This work extends classic models based on the Kingman coalescent, possibly bringing such approaches to a broader range of organisms, notably microbes. The manuscript represents a significant methodological advance, which comes in three ways:
- A new inference model, extending the multiple sequentially Markov coalescent approach (MSMC) to account for multiple mergers.
- A new graph neural network approach that can learn coalescence parameters from ancestral recombination graphs.
- Approaches based on the newly introduced models to infer regions under selection along the genome.
The two reviewers highlight the innovative aspects of the work and its great application potential. However, both indicate that the presentation of the model and results should be improved. They provide detailed comments and suggestions that, I believe, will be useful to the authors to improve their manuscript. I further highlight below some points that I think the authors should address:
1) The extensive mathematical developments require that their detailed exposure be provided as supplementary material. This exposure is, however, incomplete in several places, and some critical information is missing in the main text:
It is indicated that SMbetaC can be run on ARGs instead of sequences (e.g. l211). How does the inference work in such a case? That is, what are the hidden states? I could not find a description of this approach in the supplementary text, which only describes the standard model where genealogies are the hidden states.
How are selection scans performed? Is the alpha parameter allowed to vary along the genome? How can it be inferred in a "local" manner?
I agree with reviewer 2 that a detailed assessment of the math in the supplementary material would require much time. However, a relatively simple and efficient check can be made for such complex models: simulating data under the exact inference model (that is, under the SMbetaC model). The maximum likelihood theorem stipulates that the parameter inference should be unbiased under such conditions. Simulating data under the "real" process, as the authors perform, is of greater practical importance. Still, simulations under the inference model offer insurance that the model is correctly implemented, and I encourage the authors to verify this.
2) I did not understand why the author looked at the "classic" LD, and as pointed out by reviewer 2, the discussion on the Markovian hypothesis is unclear, if not inaccurate. First, the Markovian assumption is also violated under the Kingman coalescent; this is not specific to the beta-coalescent. Furthermore, while the SMC captures some kind of LD (so-called topological LD), how it relates to the more classic notion of LD based on haplotype frequencies is not straightforward. As the manuscript is already dense, I suggest removing this part and focusing on the topological LD (the transition matrix).
Minor:
l29: I am not sure how common knowledge the "survivorship types" are. Maybe a reference could be added?
l50: Haploid organisms: could a few sentences be added to indicate the main differences with a diploid model? It is discussed in the "Discussion" part, but I feel some information for the non-expert would be helpful here.
l162 "All SMC approaches used in this manuscript are found in the R package eSMC2.": as I understand this sentence, the authors have reimplemented the MSMC model. Is that so? l263 (also l283), the authors say that they used MSMC and MSMC2. If the authors do not mean the original software, they should state it clearly. In such a case, they should also indicate how the implementation differs from the original in terms of parametrisation, estimation procedure, etc.
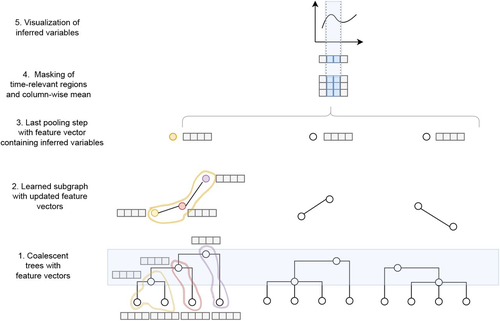
Fig1: I agree with reviewer 1 that Figure 1 is not informative. It isn't easy to guess what the various graphs, dots, squares and curves represent.
l171: number OF coalescence trees. As THE batch size is fixed.
l212: can msprime simulate selection? How exactly?
l291: I agree with reviewer 2's comment and suggestion on the scaling. Furthermore, some references should be added.
Fig2: I did not get why PSMC is mentioned here (and, unless I am mistaken, only here).
l328: It does not seem to me that the GNNcoal approach exhibits "high accuracy" in the case where alpha = 1.3
FigS4-S7: the figure titles should state the demographic scenario (currently, all figures share the same title). Furthermore, in the case of population expansion/collapse, the population size change falls out of the resolution of the inference model so that it only infers constant population sizes in several cases. For alpha = 1.7 and 1.9, a more ancient size shift should be considered (Figures S5-7).
Fig4: what are the light grey lines?
Fig5: I think this figure might be easier to read (notably to compare the panels) if the y-axis represented (relative) errors ((estimated value - true value)/(true value)
l363: it seems that the wrong figures are mentioned here.
l463: In practice, we will never get the true ARG, so this does not constitute an advantage of the GNNcoal. Maybe this should be rephrased as a perspective, like "as ARG inference method improve, GNN models will offer a promising alternative to..."
Reviewed by anonymous reviewer 1, 30 Aug 2023
Reviewed by anonymous reviewer 2, 28 Sep 2023
This preprint describes two new methods to estimate evolutionary parameters (coalescence rates and a parameter alpha describing multiple merger rates) from sequence data. The methods address the impressively hard problem of demographic inference in the presence of multiple-merger coalescent dynamics which is certainly novel. While I must admit that I could not go through the two supplementary texts in the necessary detail to fully review it (they are too extensive for me and a review of them is simply beyond my time budget), I see no reason to doubt the authors' expertise and suggest to then rely on community review after publication.
I have a number of comments on the main article and supplementary Figures which hopefully help improving the clarity of the paper or possibly point to some gaps in the story that need to be filled before recommendation:
1) L 248ff: With the GNN method, I did not understand why the smoothing of the inferred demography from the GNN happens after the inference. It appears to me as if regularization should be built in right into the inference method. For example, why not infer B-splines, or if that is too hard, put penalties on large jumps between the piecewise constant rates in the model?
2) Figure 2: I am quite confused about the "scaling discrepancy between the Kingman and beta-coalescent" (L 289f), as seen in the figure. In the figure, it looks like the notion of "population size" in the beta-coalescent is something that is between 2 and 3 orders of magnitude below what is called a "population size" in the Kingman-coalescent. Surely this cannot then mean the same concept? I don't know beta-coalescent theory well, but I suppose whatever is described there cannot be interpreted as a "population size" in the same sense as in the Kingman coalescent.
Maybe I am overlooking something, but I think if this is really just some artifact in the definitions of rates, they should simply always be shown in their "corrected version" in the main text. At the very minimum, I suggest to replace Figure 2 by Supplementary Figure S1. But even better would be a good explanation, or perhaps general synchonisation, of the 100-1000fold difference in the concept of "population size" between the two models.
3) Figure 3 and text describing it: I think the authors made a confusing choice for Figure 3 to show different x-axis scales. The three plots all look the same, but have different scales, so the difference is hard to see. I suggest to use the same scale, so the reader can appreciate the difference.
4) Related to point above in Figure 3: I don't quite understand whether the shown LD decay for lower values of alpha is really qualitatively different from the Kingman-coalescent. I believe the authors when they say that multiple mergers lead to long-range effects, but on the Figures, it doesn't look qualitatively different, it just looks quantitatively different. Where can I see the "qualitative"? Why does a longer LD decay necessarily demonstrate "violation of the Markovian hypothesis"? I think this both needs to be explained better, and it needs to be shown more convincingly.
5) Fig S2 and S3: The authors show these residual matrices of the observed vs. theoretical transition matrices. This is in principle nice, but after all leaves me a bit puzzled about what I'm supposed to see. The authors point out the fact that S2 looks more random, while S3 looks more structured, but I don't get why the seeming randomness in S2 should be interpreted such that the matrix is "well approximated" (L 313), nor do I get why the patterns in S3 should be interpreted such that there are "significant differences" between observed and predicted" (L 316f). It seems to me that whether or not the residuals are structured or not is somewhat of an orthogonal question to question whether the differences are significant or not. In particular, they live on the same color scales.
6) By the way, the tick marks in the color legends of Figures S2 and S3 have an error as far as I can see. The topmost tick marks should be "[10^{-7}, 1[", and not "[10^{-10}, 1[", right?
7) Fig S6 and S7: Why did you choose the timing of the expansion or contraction of the population size to be so recent? It seems that for most chosen alpha values, the inference is far away from the "interesting" time period.
8) L 347ff: I was confused by the text here, which I understood in such a way that the GNN was run on a downsampled dataset to sample size of three, then pointing at Futures S4-S7. But in those figures, the figure legend indicates that the full 10 haplotypes were used. Is this just a typo, or did I misunderstand something?
10) L 384f: "In contrast, SMbC produces better inferences of alpha ..." -> better than what?
11) Figure S1, caption: The math seems a bit garbled to me, with single brackets as superscripts and such.
https://doi.org/10.24072/pci.evolbiol.100699.rev12


