
Latest recommendations

| Id | Title | Authors | Abstract▲ | Picture | Thematic fields | Recommender | Reviewers | Submission date | |
|---|---|---|---|---|---|---|---|---|---|
06 Sep 2022
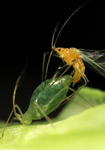
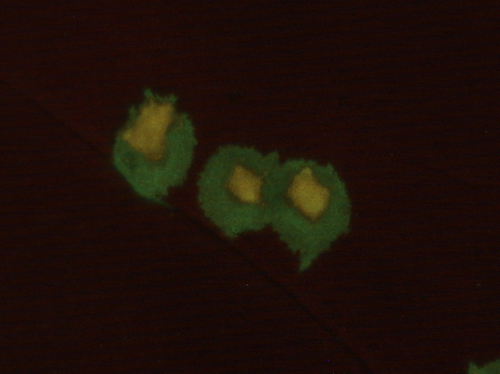
Masculinization of the X-chromosome in aphid soma and gonadsSex-biased gene expression is not tissue-specific in Pea AphidsRecommended by Charles Baer and Tanja Schwander based on reviews by Ann Kathrin Huylmans and 1 anonymous reviewerSexual antagonism (SA), wherein the fitness interests of the sexes do not align, is inherent to organisms with two (or more) sexes. SA leads to intra-locus sexual conflict, where an allele that confers higher fitness in one sex reduces fitness in the other [1, 2]. This situation leads to what has been referred to as "gender load", resulting from the segregation of SA alleles in the population. Gender load can be reduced by the evolution of sex-specific (or sex-biased) gene expression. A specific prediction is that gene-duplication can lead to sub- or neo-functionalization, in which case the two duplicates partition the function in the different sexes. The conditions for invasion by a SA allele differ between sex-chromosomes and autosomes, leading to the prediction that (in XY or XO systems) the X should accumulate recessive male-favored alleles and dominant female-favored alleles; similar considerations apply in ZW systems ([3, but see 4]. Aphids present an interesting special case, for several reasons: they have XO sex-determination, and three distinct reproductive morphs (sexual females, parthenogenetic females, and males). Previous theoretical work by the lead author predict that the X should be optimized for male function, which was borne out by whole-animal transcriptome analysis [5]. Here [6], the authors extend that work to investigate “tissue”-specific (heads, legs and gonads), sex-specific gene expression. They argue that, if intra-locus SA is the primary driver of sex-biased gene expression, it should be generally true in all tissues. They set up as an alternative the possibility that sex-biased gene expression could also be driven by dosage compensation. They cite references supporting their argument that "dosage compensation (could be) stronger in the brain", although the underlying motivation for that argument appears to be based on empirical evidence rather than theoretical predictions. At any rate, the results are clear: all tissues investigated show masculinization of the X. Further, X-linked copies of gene duplicates were more frequently male-biased than duplicated autosomal genes or X-linked single-copy genes. To sum up, this is a nice empirical study with clearly interpretable (and interpreted) results, the most obvious of which is the greater sex-biased expression in sexually-dimorphic tissues. Unfortunately, as the authors emphasize, there is no general theory by which SA, variable dosage-compensation, and meiotic sex chromosome inactivation can be integrated in a predictive framework. It is to be hoped that empirical studies such as this one will motivate deeper and more general theoretical investigations. References [1] Rice WR, Chippindale AK (2001) Intersexual ontogenetic conflict. Journal of Evolutionary Biology 14: 685-693. https://doi.org/10.1046/j.1420-9101.2001.00319.x [2] Bonduriansky R, Chenoweth SF (2009) Intralocus sexual conflict. Trends Ecol Evol 24: 280-288. https://doi.org/10.1016/j.tree.2008.12.005 [3] Rice WR. (1984) Sex chromosomes and the evolution of sexual dimorphism. Evolution 38: 735-742. https://doi.org/10.1086/595754 [4] Fry JD (2010) The genomic location of sexually antagonistic variation: some cautionary comments. Evolution 64: 1510-1516. https://doi.org/10.1111%2Fj.1558-5646.2009.00898.x [5] Jaquiéry J, Rispe C, Roze D, Legeai F, Le Trionnaire G, Stoeckel S, et al. (2013) Masculinization of the X Chromosome in the Pea Aphid. PLoS Genetics 9. https://doi.org/10.1371/journal.pgen.1003690 [6] Jaquiéry J, Simon J-C, Robin S, Richard G, Peccoud J, Boulain H, Legeai F, Tanguy S, Prunier-Leterme N, Le Trionnaire G (2022) Masculinization of the X-chromosome in aphid soma and gonads. bioRxiv, 2021.08.13.453080, ver. 4 peer-reviewed and recommended by Peer Community in Evolutionary Biology. https://doi.org/10.1101/2021.08.13.453080 | Masculinization of the X-chromosome in aphid soma and gonads | Julie Jaquiery, Jean-Christophe Simon, Stephanie Robin, Gautier Richard, Jean Peccoud, Helene Boulain, Fabrice Legeai, Sylvie Tanguy, Nathalie Prunier-Leterme, Gael Letrionnaire | <p>Males and females share essentially the same genome but differ in their optimal values for many phenotypic traits, which can result in intra-locus conflict between the sexes. Aphids display XX/X0 sex chromosomes and combine unusual X chromosome... | | Genetic conflicts, Genome Evolution, Reproduction and Sex | Charles Baer | 2021-08-16 08:56:08 | ||
12 Nov 2020
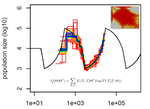
Limits and Convergence properties of the Sequentially Markovian CoalescentReview and Assessment of Performance of Genomic Inference Methods based on the Sequentially Markovian CoalescentRecommended by Stephan Schiffels based on reviews by 3 anonymous reviewers based on reviews by 3 anonymous reviewers
The human genome not only encodes for biological functions and for what makes us human, it also encodes the population history of our ancestors. Changes in past population sizes, for example, affect the distribution of times to the most recent common ancestor (tMRCA) of genomic segments, which in turn can be inferred by sophisticated modelling along the genome. References [1] Li, H., and Durbin, R. (2011). Inference of human population history from individual whole-genome sequences. Nature, 475(7357), 493-496. doi: https://doi.org/10.1038/nature10231 | Limits and Convergence properties of the Sequentially Markovian Coalescent | Thibaut Sellinger, Diala Abu Awad, Aurélien Tellier | <p>Many methods based on the Sequentially Markovian Coalescent (SMC) have been and are being developed. These methods make use of genome sequence data to uncover population demographic history. More recently, new methods have extended the original... | | Population Genetics / Genomics | Stephan Schiffels | Anonymous | 2020-07-25 10:54:48 | |
06 Oct 2017
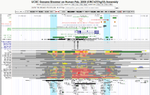
Evolutionary analysis of candidate non-coding elements regulating neurodevelopmental genes in vertebratesCombining molecular information on chromatin organisation with eQTLs and evolutionary conservation provides strong candidates for the evolution of gene regulation in mammalian brainsRecommended by Marc Robinson-Rechavi based on reviews by Marc Robinson-Rechavi and Charles DankoIn this manuscript [1], Francisco J. Novo proposes candidate non-coding genomic elements regulating neurodevelopmental genes. What is very nice about this study is the way in which public molecular data, including physical interaction data, is used to leverage recent advances in our understanding to molecular mechanisms of gene regulation in an evolutionary context. More specifically, evolutionarily conserved non coding sequences are combined with enhancers from the FANTOM5 project, DNAse hypersensitive sites, chromatin segmentation, ChIP-seq of transcription factors and of p300, gene expression and eQTLs from GTEx, and physical interactions from several Hi-C datasets. The candidate regulatory regions thus identified are linked to candidate regulated genes, and the author shows their potential implication in brain development. While the results are focused on a small number of genes, this allows to verify features of these candidates in great detail. This study shows how functional genomics is increasingly allowing us to fulfill the promises of Evo-Devo: understanding the molecular mechanisms of conservation and differences in morphology. References [1] Novo, FJ. 2017. Evolutionary analysis of candidate non-coding elements regulating neurodevelopmental genes in vertebrates. bioRxiv, 150482, ver. 4 of Sept 29th, 2017. doi: 10.1101/150482 | Evolutionary analysis of candidate non-coding elements regulating neurodevelopmental genes in vertebrates | Francisco J. Novo | <p>Many non-coding regulatory elements conserved in vertebrates regulate the expression of genes involved in development and play an important role in the evolution of morphology through the rewiring of developmental gene networks. Available biolo... | | Genome Evolution | Marc Robinson-Rechavi | Marc Robinson-Rechavi, Charles Danko | 2017-06-29 08:55:41 | |
12 Feb 2024
How do plant RNA viruses overcome the negative effect of Muller s ratchet despite strong transmission bottlenecks?How to survive the mutational meltdown: lessons from plant RNA virusesRecommended by Kavita Jain based on reviews by Brent Allman, Ana Morales-Arce and 1 anonymous reviewerAlthough most mutations are deleterious, the strongly deleterious ones do not spread in a very large population as their chance of fixation is very small. Another mechanism via which the deleterious mutations can be eliminated is via recombination or sexual reproduction. However, in a finite asexual population, the subpopulation without any deleterious mutation will eventually acquire a deleterious mutation resulting in the reduction of the population size or in other words, an increase in the genetic drift. This, in turn, will lead the population to acquire deleterious mutations at a faster rate eventually leading to a mutational meltdown. This irreversible (or, at least over some long time scales) accumulation of deleterious mutations is especially relevant to RNA viruses due to their high mutation rate, and while the prior work has dealt with bacteriophages and RNA viruses, the study by Lafforgue et al. [1] makes an interesting contribution to the existing literature by focusing on plants. In this study, the authors enquire how despite the repeated increase in the strength of genetic drift, how the RNA viruses manage to survive in plants. Following a series of experiments and some numerical simulations, the authors find that as expected, after severe bottlenecks, the fitness of the population decreases significantly. But if the bottlenecks are followed by population expansion, the Muller’s ratchet can be halted due to the genetic diversity generated during population growth. They hypothesize this mechanism as a potential way by which the RNA viruses can survive the mutational meltdown. As a theoretician, I find this investigation quite interesting and would like to see more studies addressing, e.g., the minimum population growth rate required to counter the potential extinction for a given bottleneck size and deleterious mutation rate. Of course, it would be interesting to see in future work if the hypothesis in this article can be tested in natural populations. References [1] Guillaume Lafforgue, Marie Lefebvre, Thierry Michon, Santiago F. Elena (2024) How do plant RNA viruses overcome the negative effect of Muller s ratchet despite strong transmission bottlenecks? bioRxiv, ver. 3 peer-reviewed and recommended by Peer Community In Evolutionary Biology | How do plant RNA viruses overcome the negative effect of Muller s ratchet despite strong transmission bottlenecks? | Guillaume Lafforgue, Marie Lefebvre, Thierry Michon, Santiago F. Elena | <p>Muller's ratchet refers to the irreversible accumulation of deleterious mutations in small populations, resulting in a decline in overall fitness. This phenomenon has been extensively observed in experiments involving microorganisms, including ... | | Experimental Evolution, Genome Evolution | Kavita Jain | 2023-08-04 09:37:08 | ||
05 Jun 2018
The dynamics of preferential host switching: host phylogeny as a key predictor of parasite prevalence and distributionShift or stick? Untangling the signatures of biased host switching, and host-parasite co-speciationRecommended by Lucy Weinert based on reviews by Damien de Vienne and Nathan MeddMany emerging diseases arise by parasites switching to new host species, while other parasites seem to remain with same host lineage for very long periods of time, even over timescales where an ancestral host species splits into two or more new species. The ability to understand these dynamics would form an important part of our understanding of infectious disease. Experiments are clearly important for understanding these processes, but so are comparative studies, investigating the variation that we find in nature. Such comparative data do show strong signs of non-randomness, and this suggests that the epidemiological and ecological processes might be predictable, at least in part. For example, when we map patterns of parasite presence/absence onto host phylogenies, we often find that certain host clades harbour many more parasites than expected, or that closely-related hosts harbour closely-related parasites. Nevertheless, it remains difficult to interpret these patterns to make inferences about ecological and epidemiological processes. This is partly because non-random associations can arise in multiple ways. For example, parasites might be inherited from the common ancestor of related hosts, or might switch to new hosts, but preferentially establish on novel hosts that are closely related to their existing host. Infection might also influence the shape of host phylogeny, either by increasing the rate of host extinction or, conversely, increasing the rate of speciation (as with manipulative symbionts that might induce reproductive isolation). These various processes have, by and large, been studied in isolation, but the model introduced by Engelstädter and Fortuna [1], makes an important first step towards studying them together. Without such combined analyses, we will not be able to tell if the processes have their own unique signatures, or whether the same sort of non-randomness can arise in multiple ways. A major finding of the work is that the size of a host clade can be an important determinant of its overall infection level. This had been shown in previous work, assuming that the host phylogeny was fixed, but the current paper shows that it extends also to situations where host extinction and speciation takes place at a comparable rate to host shifting. This finding, then, calls into question the natural assumption that a clade of host species that is highly parasite ridden, must have some genetic or ecological characteristic that makes them particularly prone to infection, arguing that the clade size, rather than any characteristic of the clade members, might be the important factor. It will be interesting to see whether this prediction about clade size is borne out with comparative studies. Another feature of the study is that the framework is naturally extendable, to include further processes, such as the influence of parasite presence on extinction or speciation rates. No doubt extensions of this kind will form the basis of important future work. References [1] Engelstädter J and Fortuna NZ. 2018. The dynamics of preferential host switching: host phylogeny as a key predictor of parasite prevalence and distribution. bioRxiv 209254 ver. 5 peer-reviewed by Peer Community In Evolutionary Biology. doi: 10.1101/209254 | The dynamics of preferential host switching: host phylogeny as a key predictor of parasite prevalence and distribution | Jan Engelstaedter & Nicole Fortuna | <p>New parasites commonly arise through host-shifts, where parasites from one host species jump to and become established in a new host species. There is much evidence that the probability of host-shifts decreases with increasing phylogenetic dist... | | Bioinformatics & Computational Biology, Evolutionary Epidemiology, Evolutionary Theory, Macroevolution, Phylogenetics / Phylogenomics, Species interactions | Lucy Weinert | 2017-10-30 02:06:06 | ||
06 Jun 2019
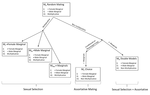
Multi-model inference of non-random mating from an information theoretic approachTell me who you mate with, I’ll tell you what’s going onRecommended by Sara Magalhaes and Alexandre Courtiol based on reviews by Alexandre Courtiol and 2 anonymous reviewersThe study of sexual selection goes as far as Darwin himself. Since then, elaborate theories concerning both intra- and inter-sexual sexual have been developed, and elegant experiments have been designed to test this body of theory. It may thus come as a surprise that the community is still debating on the correct way to measure simple components of sexual selection, such as the Bateman gradient (i.e., the covariance between the number of matings and the number of offspring)[1,2], or to quantify complex behaviours such as mate choice (the non-random choice of individuals with particular characters as mates)[3,4] and their consequences. References [1] Bateman, A. J. (1948). Intra-sexual selection in Drosophila. Heredity, 2(3), 349-368. doi: 10.1038/hdy.1948.21 | Multi-model inference of non-random mating from an information theoretic approach | Antonio Carvajal-Rodríguez | <p>Non-random mating has a significant impact on the evolution of organisms. Here, I developed a modelling framework for discrete traits (with any number of phenotypes) to explore different models connecting the non-random mating causes (mate comp... | | Evolutionary Ecology, Evolutionary Theory, Sexual Selection | Sara Magalhaes | 2019-02-08 19:24:03 | ||
13 Sep 2019
Deceptive combined effects of short allele dominance and stuttering: an example with Ixodes scapularis, the main vector of Lyme disease in the U.S.A.New curation method for microsatellite markers improves population genetics analysesRecommended by Aurelien Tellier based on reviews by Eric Petit, Martin Husemann and 2 anonymous reviewersGenetic markers are used for in modern population genetics/genomics to uncover the past neutral and selective history of population and species. Besides Single Nucleotide Polymorphisms (SNPs) obtained from whole genome data, microsatellites (or Short Tandem Repeats, SSR) have been common markers of choice in numerous population genetics studies of non-model species with large sample sizes [1]. Microsatellites can be used to uncover and draw inference of the past population demography (e.g. expansion, decline, bottlenecks…), population split, population structure and gene flow, but also life history traits and modes of reproduction (e.g. [2,3]). These markers are widely used in conservation genetics [4] or to study parasites or disease vectors [5]. Microsatellites do show higher mutation rate than SNPs increasing, on the one hand, the statistical power to infer recent events (for example crop domestication, [2,3]), while, on the other hand, decreasing their statistical power over longer time scales due to homoplasy [6]. References [1] Jarne, P., and Lagoda, P. J. (1996). Microsatellites, from molecules to populations and back. Trends in ecology & evolution, 11(10), 424-429. doi: 10.1016/0169-5347(96)10049-5 | Deceptive combined effects of short allele dominance and stuttering: an example with Ixodes scapularis, the main vector of Lyme disease in the U.S.A. | Thierry De Meeûs, Cynthia T. Chan, John M. Ludwig, Jean I. Tsao, Jaymin Patel, Jigar Bhagatwala, and Lorenza Beati | <p>Null alleles, short allele dominance (SAD), and stuttering increase the perceived relative inbreeding of individuals and subpopulations as measured by Wright’s FIS and FST. Ascertainment bias, due to such amplifying problems are usually caused ... | | Evolutionary Ecology, Other, Population Genetics / Genomics | Aurelien Tellier | 2019-05-02 20:52:08 | ||
11 Dec 2020
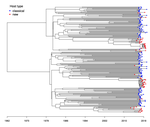
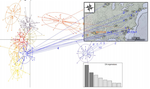
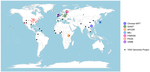
Quantifying transmission dynamics of acute hepatitis C virus infections in a heterogeneous population using sequence dataPhylodynamics of hepatitis C virus reveals transmission dynamics within and between risk groups in LyonRecommended by David Rasmussen based on reviews by Chris Wymant and Louis DuPlessisGenomic epidemiology seeks to better understand the transmission dynamics of infectious pathogens using molecular sequence data. Phylodynamic methods have given genomic epidemiology new power to track the transmission dynamics of pathogens by combining phylogenetic analyses with epidemiological modeling. In recent year, applications of phylodynamics to chronic viral infections such as HIV and hepatitis C virus (HVC) have provided some of the best examples of how phylodynamic inference can provide valuable insights into transmission dynamics within and between different subpopulations or risk groups, allowing for more targeted interventions. References [1] Rasmussen, D. A., Volz, E. M., and Koelle, K. (2014). Phylodynamic inference for structured epidemiological models. PLoS Comput Biol, 10(4), e1003570. doi: https://doi.org/10.1371/journal.pcbi.1003570 | Quantifying transmission dynamics of acute hepatitis C virus infections in a heterogeneous population using sequence data | Gonche Danesh, Victor Virlogeux, Christophe Ramière, Caroline Charre, Laurent Cotte, Samuel Alizon | <p>Opioid substitution and syringes exchange programs have drastically reduced hepatitis C virus (HCV) spread in France but HCV sexual transmission in men having sex with men (MSM) has recently arisen as a significant public health concern. The fa... | | Evolutionary Epidemiology, Phylogenetics / Phylogenomics | David Rasmussen | 2019-07-11 13:37:23 | ||
06 Apr 2021
How robust are cross-population signatures of polygenic adaptation in humans?Be careful when studying selection based on polygenic score overdispersionRecommended by Torsten Günther based on reviews by Lawrence Uricchio, Mashaal Sohail, Barbara Bitarello and 1 anonymous reviewer
The advent of genome-wide association studies (GWAS) has been a great promise for our understanding of the connection between genotype and phenotype. Today, the NHGRI-EBI GWAS catalog contains 251,401 associations from 4,961 studies (1). This wealth of studies has also generated interest to use the summary statistics beyond the few top hits in order to make predictions for individuals without known phenotype, e.g. to predict polygenic risk scores or to study polygenic selection by comparing different groups. For instance, polygenic selection acting on the most studied polygenic trait, height, has been subject to multiple studies during the past decade (e.g. 2–6). They detected north-south gradients in Europe which were consistent with expectations. However, their GWAS summary statistics were based on the GIANT consortium data set, a meta-analysis of GWAS conducted in different European cohorts (7,8). The availability of large data sets with less stratification such as the UK Biobank (9) has led to a re-evaluation of those results. The nature of the GIANT consortium data set was realized to represent a potential problem for studies of polygenic adaptation which led several of the authors of the original articles to caution against the interpretations of polygenic selection on height (10,11). This was a great example on how the scientific community assessed their own earlier results in a critical way as more data became available. At the same time it left the question whether there is detectable polygenic selection separating populations more open than ever. Generally, recent years have seen several articles critically assessing the portability of GWAS results and risk score predictions to other populations (12–14). Refoyo-Martínez et al. (15) are now presenting a systematic assessment on the robustness of cross-population signatures of polygenic adaptation in humans. They compiled GWAS results for complex traits which have been studied in more than one cohort and then use allele frequencies from the 1000 Genomes Project data (16) set to detect signals of polygenic score overdispersion. As the source for the allele frequencies is kept the same across all tests, differences between the signals must be caused by the underlying GWAS. The results are concerning as the level of overdispersion largely depends on the choice of GWAS cohort. Cohorts with homogenous ancestries show little to no overdispersion compared to cohorts of mixed ancestries such as meta-analyses. It appears that the meta-analyses fail to fully account for stratification in their data sets. The authors based most of their analyses on the heavily studied trait height. Additionally, they use educational attainment (measured as the number of school years of an individual) as an example. This choice was due to the potential over- or misinterpretation of results by the media, the general public and by far right hate groups. Such traits are potentially confounded by unaccounted cultural and socio-economic factors. Showing that previous results about polygenic selection on educational attainment are not robust is an important result that needs to be communicated well. This forms a great example for everyone working in human genomics. We need to be aware that our results can sometimes be misinterpreted. And we need to make an effort to write our papers and communicate our results in a way that is honest about the limitations of our research and that prevents the misuse of our results by hate groups. This article represents an important contribution to the field. It is cruicial to be aware of potential methodological biases and technical artifacts. Future studies of polygenic adaptation need to be cautious with their interpretations of polygenic score overdispersion. A recommendation would be to use GWAS results obtained in homogenous cohorts. But even if different biobank-scale cohorts of homogeneous ancestry are employed, there will always be some remaining risk of unaccounted stratification. These conclusions may seem sobering but they are part of the scientific process. We need additional controls and new, different methods than polygenic score overdispersion for assessing polygenic selection. Last year also saw the presentation of a novel approach using sequence data and GWAS summary statistics to detect directional selection on a polygenic trait (17). This new method appears to be robust to bias stemming from stratification in the GWAS cohort as well as other confounding factors. Such new developments show light at the end of the tunnel for the use of GWAS summary statistics in the study of polygenic adaptation. References 1. Buniello A, MacArthur JAL, Cerezo M, Harris LW, Hayhurst J, Malangone C, et al. The NHGRI-EBI GWAS Catalog of published genome-wide association studies, targeted arrays and summary statistics 2019. Nucleic Acids Research. 2019 Jan 8;47(D1):D1005–12. doi: https://doi.org/10.1093/nar/gky1120 2. Turchin MC, Chiang CW, Palmer CD, Sankararaman S, Reich D, Hirschhorn JN. Evidence of widespread selection on standing variation in Europe at height-associated SNPs. Nature Genetics. 2012 Sep;44(9):1015–9. doi: https://doi.org/10.1038/ng.2368 3. Berg JJ, Coop G. A Population Genetic Signal of Polygenic Adaptation. PLOS Genetics. 2014 Aug 7;10(8):e1004412. doi: https://doi.org/10.1371/journal.pgen.1004412 4. Robinson MR, Hemani G, Medina-Gomez C, Mezzavilla M, Esko T, Shakhbazov K, et al. Population genetic differentiation of height and body mass index across Europe. Nature Genetics. 2015 Nov;47(11):1357–62. doi: https://doi.org/10.1038/ng.3401 5. Mathieson I, Lazaridis I, Rohland N, Mallick S, Patterson N, Roodenberg SA, et al. Genome-wide patterns of selection in 230 ancient Eurasians. Nature. 2015 Dec;528(7583):499–503. doi: https://doi.org/10.1038/nature16152 6. Racimo F, Berg JJ, Pickrell JK. Detecting polygenic adaptation in admixture graphs. Genetics. 2018. Arp;208(4):1565–1584. doi: https://doi.org/10.1534/genetics.117.300489 7. Lango Allen H, Estrada K, Lettre G, Berndt SI, Weedon MN, Rivadeneira F, et al. Hundreds of variants clustered in genomic loci and biological pathways affect human height. Nature. 2010 Oct;467(7317):832–8. doi: https://doi.org/10.1038/nature09410 8. Wood AR, Esko T, Yang J, Vedantam S, Pers TH, Gustafsson S, et al. Defining the role of common variation in the genomic and biological architecture of adult human height. Nat Genet. 2014 Nov;46(11):1173–86. doi: https://doi.org/10.1038/ng.3097 9. Bycroft C, Freeman C, Petkova D, Band G, Elliott LT, Sharp K, et al. The UK Biobank resource with deep phenotyping and genomic data. Nature. 2018 Oct;562(7726):203–9. doi: https://doi.org/10.1038/s41586-018-0579-z 10. Berg JJ, Harpak A, Sinnott-Armstrong N, Joergensen AM, Mostafavi H, Field Y, et al. Reduced signal for polygenic adaptation of height in UK Biobank. eLife. 2019 Mar 21;8:e39725. doi: https://doi.org/10.7554/eLife.39725 11. Sohail M, Maier RM, Ganna A, Bloemendal A, Martin AR, Turchin MC, et al. Polygenic adaptation on height is overestimated due to uncorrected stratification in genome-wide association studies. eLife. 2019 Mar 21;8:e39702. doi: https://doi.org/10.7554/eLife.39702 12. Martin AR, Kanai M, Kamatani Y, Okada Y, Neale BM, Daly MJ. Clinical use of current polygenic risk scores may exacerbate health disparities. Nature Genetics. 2019 Apr;51(4):584–91. doi: https://doi.org/10.1038/s41588-019-0379-x 13. Bitarello BD, Mathieson I. Polygenic Scores for Height in Admixed Populations. G3: Genes, Genomes, Genetics. 2020 Nov 1;10(11):4027–36. doi: https://doi.org/10.1534/g3.120.401658 14. Uricchio LH, Kitano HC, Gusev A, Zaitlen NA. An evolutionary compass for detecting signals of polygenic selection and mutational bias. Evolution Letters. 2019;3(1):69–79. doi: https://doi.org/10.1002/evl3.97 15. Refoyo-Martínez A, Liu S, Jørgensen AM, Jin X, Albrechtsen A, Martin AR, Racimo F. How robust are cross-population signatures of polygenic adaptation in humans? bioRxiv, 2021, 2020.07.13.200030, version 5 peer-reviewed and recommended by Peer community in Evolutionary Biology. doi: https://doi.org/10.1101/2020.07.13.200030 16. Auton A, Abecasis GR, Altshuler DM, Durbin RM, Abecasis GR, Bentley DR, et al. A global reference for human genetic variation. Nature. 2015 Sep 30;526(7571):68–74. doi: https://doi.org/10.1038/nature15393 17. Stern AJ, Speidel L, Zaitlen NA, Nielsen R. Disentangling selection on genetically correlated polygenic traits using whole-genome genealogies. bioRxiv. 2020 May 8;2020.05.07.083402. doi: https://doi.org/10.1101/2020.05.07.083402 | How robust are cross-population signatures of polygenic adaptation in humans? | Alba Refoyo-Martínez, Siyang Liu, Anja Moltke Jørgensen, Xin Jin, Anders Albrechtsen, Alicia R. Martin, Fernando Racimo | <p>Over the past decade, summary statistics from genome-wide association studies (GWASs) have been used to detect and quantify polygenic adaptation in humans. Several studies have reported signatures of natural selection at sets of SNPs associated... | | Bioinformatics & Computational Biology, Genetic conflicts, Human Evolution, Population Genetics / Genomics | Torsten Günther | 2020-08-14 15:06:54 | ||
04 Sep 2019
The discernible and hidden effects of clonality on the genotypic and genetic states of populations: improving our estimation of clonal ratesHow to estimate clonality from genetic data: use large samples and consider the biology of the speciesRecommended by Myriam Heuertz based on reviews by David Macaya-Sanz, Marcela Van Loo and 1 anonymous reviewer
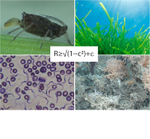
Population geneticists frequently use the genetic and genotypic information of a population sample of individuals to make inferences on the reproductive system of a species. The detection of clones, i.e. individuals with the same genotype, can give information on whether there is clonal (vegetative) reproduction in the species. If clonality is detected, population geneticists typically use genotypic richness R, the number of distinct genotypes relative to the sample size, to estimate the rate of clonality c, which can be defined as the proportion of reproductive events that are clonal. Estimating the rate of clonality based on genotypic richness is however problematic because, to date, there is no analytical, nor simulation-based, characterization of this relationship. Furthermore, the effect of sampling on this relationship has never been critically examined. References [1] Stoeckel, S., Porro, B., and Arnaud-Haond, S. (2019). The discernible and hidden effects of clonality on the genotypic and genetic states of populations: improving our estimation of clonal rates. ArXiv:1902.09365 [q-Bio] v4 peer-reviewed and recommended by Peer Community in Evolutionary Biology. Retrieved from http://arxiv.org/abs/1902.09365v4 | The discernible and hidden effects of clonality on the genotypic and genetic states of populations: improving our estimation of clonal rates | Solenn Stoeckel, Barbara Porro, Sophie Arnaud-Haond | <p>Partial clonality is widespread across the tree of life, but most population genetics models are conceived for exclusively clonal or sexual organisms. This gap hampers our understanding of the influence of clonality on evolutionary trajectories... | | Population Genetics / Genomics, Reproduction and Sex | Myriam Heuertz | 2019-02-28 10:10:56 |


