
Latest recommendations

| Id | Title | Authors | Abstract | Picture | Thematic fields▼ | Recommender | Reviewers | Submission date | |
|---|---|---|---|---|---|---|---|---|---|
06 Apr 2021
How robust are cross-population signatures of polygenic adaptation in humans?Be careful when studying selection based on polygenic score overdispersionRecommended by Torsten Günther based on reviews by Lawrence Uricchio, Mashaal Sohail, Barbara Bitarello and 1 anonymous reviewer based on reviews by Lawrence Uricchio, Mashaal Sohail, Barbara Bitarello and 1 anonymous reviewer
The advent of genome-wide association studies (GWAS) has been a great promise for our understanding of the connection between genotype and phenotype. Today, the NHGRI-EBI GWAS catalog contains 251,401 associations from 4,961 studies (1). This wealth of studies has also generated interest to use the summary statistics beyond the few top hits in order to make predictions for individuals without known phenotype, e.g. to predict polygenic risk scores or to study polygenic selection by comparing different groups. For instance, polygenic selection acting on the most studied polygenic trait, height, has been subject to multiple studies during the past decade (e.g. 2–6). They detected north-south gradients in Europe which were consistent with expectations. However, their GWAS summary statistics were based on the GIANT consortium data set, a meta-analysis of GWAS conducted in different European cohorts (7,8). The availability of large data sets with less stratification such as the UK Biobank (9) has led to a re-evaluation of those results. The nature of the GIANT consortium data set was realized to represent a potential problem for studies of polygenic adaptation which led several of the authors of the original articles to caution against the interpretations of polygenic selection on height (10,11). This was a great example on how the scientific community assessed their own earlier results in a critical way as more data became available. At the same time it left the question whether there is detectable polygenic selection separating populations more open than ever. Generally, recent years have seen several articles critically assessing the portability of GWAS results and risk score predictions to other populations (12–14). Refoyo-Martínez et al. (15) are now presenting a systematic assessment on the robustness of cross-population signatures of polygenic adaptation in humans. They compiled GWAS results for complex traits which have been studied in more than one cohort and then use allele frequencies from the 1000 Genomes Project data (16) set to detect signals of polygenic score overdispersion. As the source for the allele frequencies is kept the same across all tests, differences between the signals must be caused by the underlying GWAS. The results are concerning as the level of overdispersion largely depends on the choice of GWAS cohort. Cohorts with homogenous ancestries show little to no overdispersion compared to cohorts of mixed ancestries such as meta-analyses. It appears that the meta-analyses fail to fully account for stratification in their data sets. The authors based most of their analyses on the heavily studied trait height. Additionally, they use educational attainment (measured as the number of school years of an individual) as an example. This choice was due to the potential over- or misinterpretation of results by the media, the general public and by far right hate groups. Such traits are potentially confounded by unaccounted cultural and socio-economic factors. Showing that previous results about polygenic selection on educational attainment are not robust is an important result that needs to be communicated well. This forms a great example for everyone working in human genomics. We need to be aware that our results can sometimes be misinterpreted. And we need to make an effort to write our papers and communicate our results in a way that is honest about the limitations of our research and that prevents the misuse of our results by hate groups. This article represents an important contribution to the field. It is cruicial to be aware of potential methodological biases and technical artifacts. Future studies of polygenic adaptation need to be cautious with their interpretations of polygenic score overdispersion. A recommendation would be to use GWAS results obtained in homogenous cohorts. But even if different biobank-scale cohorts of homogeneous ancestry are employed, there will always be some remaining risk of unaccounted stratification. These conclusions may seem sobering but they are part of the scientific process. We need additional controls and new, different methods than polygenic score overdispersion for assessing polygenic selection. Last year also saw the presentation of a novel approach using sequence data and GWAS summary statistics to detect directional selection on a polygenic trait (17). This new method appears to be robust to bias stemming from stratification in the GWAS cohort as well as other confounding factors. Such new developments show light at the end of the tunnel for the use of GWAS summary statistics in the study of polygenic adaptation. References 1. Buniello A, MacArthur JAL, Cerezo M, Harris LW, Hayhurst J, Malangone C, et al. The NHGRI-EBI GWAS Catalog of published genome-wide association studies, targeted arrays and summary statistics 2019. Nucleic Acids Research. 2019 Jan 8;47(D1):D1005–12. doi: https://doi.org/10.1093/nar/gky1120 2. Turchin MC, Chiang CW, Palmer CD, Sankararaman S, Reich D, Hirschhorn JN. Evidence of widespread selection on standing variation in Europe at height-associated SNPs. Nature Genetics. 2012 Sep;44(9):1015–9. doi: https://doi.org/10.1038/ng.2368 3. Berg JJ, Coop G. A Population Genetic Signal of Polygenic Adaptation. PLOS Genetics. 2014 Aug 7;10(8):e1004412. doi: https://doi.org/10.1371/journal.pgen.1004412 4. Robinson MR, Hemani G, Medina-Gomez C, Mezzavilla M, Esko T, Shakhbazov K, et al. Population genetic differentiation of height and body mass index across Europe. Nature Genetics. 2015 Nov;47(11):1357–62. doi: https://doi.org/10.1038/ng.3401 5. Mathieson I, Lazaridis I, Rohland N, Mallick S, Patterson N, Roodenberg SA, et al. Genome-wide patterns of selection in 230 ancient Eurasians. Nature. 2015 Dec;528(7583):499–503. doi: https://doi.org/10.1038/nature16152 6. Racimo F, Berg JJ, Pickrell JK. Detecting polygenic adaptation in admixture graphs. Genetics. 2018. Arp;208(4):1565–1584. doi: https://doi.org/10.1534/genetics.117.300489 7. Lango Allen H, Estrada K, Lettre G, Berndt SI, Weedon MN, Rivadeneira F, et al. Hundreds of variants clustered in genomic loci and biological pathways affect human height. Nature. 2010 Oct;467(7317):832–8. doi: https://doi.org/10.1038/nature09410 8. Wood AR, Esko T, Yang J, Vedantam S, Pers TH, Gustafsson S, et al. Defining the role of common variation in the genomic and biological architecture of adult human height. Nat Genet. 2014 Nov;46(11):1173–86. doi: https://doi.org/10.1038/ng.3097 9. Bycroft C, Freeman C, Petkova D, Band G, Elliott LT, Sharp K, et al. The UK Biobank resource with deep phenotyping and genomic data. Nature. 2018 Oct;562(7726):203–9. doi: https://doi.org/10.1038/s41586-018-0579-z 10. Berg JJ, Harpak A, Sinnott-Armstrong N, Joergensen AM, Mostafavi H, Field Y, et al. Reduced signal for polygenic adaptation of height in UK Biobank. eLife. 2019 Mar 21;8:e39725. doi: https://doi.org/10.7554/eLife.39725 11. Sohail M, Maier RM, Ganna A, Bloemendal A, Martin AR, Turchin MC, et al. Polygenic adaptation on height is overestimated due to uncorrected stratification in genome-wide association studies. eLife. 2019 Mar 21;8:e39702. doi: https://doi.org/10.7554/eLife.39702 12. Martin AR, Kanai M, Kamatani Y, Okada Y, Neale BM, Daly MJ. Clinical use of current polygenic risk scores may exacerbate health disparities. Nature Genetics. 2019 Apr;51(4):584–91. doi: https://doi.org/10.1038/s41588-019-0379-x 13. Bitarello BD, Mathieson I. Polygenic Scores for Height in Admixed Populations. G3: Genes, Genomes, Genetics. 2020 Nov 1;10(11):4027–36. doi: https://doi.org/10.1534/g3.120.401658 14. Uricchio LH, Kitano HC, Gusev A, Zaitlen NA. An evolutionary compass for detecting signals of polygenic selection and mutational bias. Evolution Letters. 2019;3(1):69–79. doi: https://doi.org/10.1002/evl3.97 15. Refoyo-Martínez A, Liu S, Jørgensen AM, Jin X, Albrechtsen A, Martin AR, Racimo F. How robust are cross-population signatures of polygenic adaptation in humans? bioRxiv, 2021, 2020.07.13.200030, version 5 peer-reviewed and recommended by Peer community in Evolutionary Biology. doi: https://doi.org/10.1101/2020.07.13.200030 16. Auton A, Abecasis GR, Altshuler DM, Durbin RM, Abecasis GR, Bentley DR, et al. A global reference for human genetic variation. Nature. 2015 Sep 30;526(7571):68–74. doi: https://doi.org/10.1038/nature15393 17. Stern AJ, Speidel L, Zaitlen NA, Nielsen R. Disentangling selection on genetically correlated polygenic traits using whole-genome genealogies. bioRxiv. 2020 May 8;2020.05.07.083402. doi: https://doi.org/10.1101/2020.05.07.083402 | How robust are cross-population signatures of polygenic adaptation in humans? | Alba Refoyo-Martínez, Siyang Liu, Anja Moltke Jørgensen, Xin Jin, Anders Albrechtsen, Alicia R. Martin, Fernando Racimo | <p>Over the past decade, summary statistics from genome-wide association studies (GWASs) have been used to detect and quantify polygenic adaptation in humans. Several studies have reported signatures of natural selection at sets of SNPs associated... | | Bioinformatics & Computational Biology, Genetic conflicts, Human Evolution, Population Genetics / Genomics | Torsten Günther | 2020-08-14 15:06:54 | ||
19 Feb 2018

Genomic imprinting mediates dosage compensation in a young plant XY systemDosage compensation by upregulation of maternal X alleles in both males and females in young plant sex chromosomesRecommended by Tatiana Giraud and Judith Mank based on reviews by 3 anonymous reviewersSex chromosomes evolve as recombination is suppressed between the X and Y chromosomes. The loss of recombination on the sex-limited chromosome (the Y in mammals) leads to degeneration of both gene expression and gene content for many genes [1]. Loss of gene expression or content from the Y chromosome leads to differences in gene dose between males and females for X-linked genes. Because expression levels are often correlated with gene dose [2], these hemizygous genes have a lower expression levels in the heterogametic sex. This in turn disrupts the stoichiometric balance among genes in protein complexes that have components on both the sex chromosomes and autosomes [3], which could have serious deleterious consequences for the heterogametic sex. References | Genomic imprinting mediates dosage compensation in a young plant XY system | Aline Muyle, Niklaus Zemp, Cecile Fruchard, Radim Cegan, Jan Vrana, Clothilde Deschamps, Raquel Tavares, Franck Picard, Roman Hobza, Alex Widmer, Gabriel Marais | <p>During the evolution of sex chromosomes, the Y degenerates and its expression gets reduced relative to the X and autosomes. Various dosage compensation mechanisms that recover ancestral expression levels in males have been described in animals.... | | Bioinformatics & Computational Biology, Expression Studies, Genome Evolution, Molecular Evolution, Reproduction and Sex | Tatiana Giraud | 2017-09-20 20:39:46 | ||
29 Jul 2020
POSTPRINT
The Y chromosome may contribute to sex-specific ageing in DrosophilaY chromosome makes fruit flies die youngerRecommended by Gabriel Marais, Jean-François Lemaitre and Cristina VieiraIn most animal species, males and females display distinct survival prospect, a phenomenon known as sex gap in longevity (SGL, Marais et al. 2018). The study of SGLs is crucial not only for having a full picture of the causes underlying organisms’ health, aging and death but also to initiate the development of sex-specific anti-aging interventions in humans (Austad and Bartke 2015). Three non-mutually evolutionary causes have been proposed to underlie SGLs (Marais et al. 2018). First, SGLs could be the consequences of sex-differences in life history strategies. For example, evolving dimorphic traits (e.g. body size, ornaments or armaments) may imply unequal physiological costs (e.g. developmental, maintenance) between the sexes and this may result in differences in longevity and aging. Second, mitochondria are usually transmitted by the mother and thus selection is blind to mitochondrial deleterious mutations affecting only males. Such mutations can freely accumulate in the mitochondrial genome and may reduce male longevity, a phenomenon called the mother’s curse (Frank and Hurst 1996). Third, in species with sex chromosomes, all recessive deleterious mutations will be expressed on the single X chromosome in XY males and may reduce their longevity (the unguarded X effect). In addition, the numerous transposable elements (TEs) on the Y chromosome may affect aging. TE activity is normally repressed by epigenetic regulation (DNA methylation, histone modifications and small RNAs). However, it is known that this regulation is disrupted with increasing age. Because of the TE-rich Y chromosome, more TEs may become active in old males than in old females, generating more somatic mutations, accelerating aging and reducing longevity in males (the toxic Y effect, Marais et al. 2018). References Austad, S. N., and Bartke, A. (2015). Sex differences in longevity and in responses to anti-aging interventions: A Mini-Review. Gerontology, 62(1), 40–46. 10.1159/000381472 | The Y chromosome may contribute to sex-specific ageing in Drosophila | Emily J Brown, Alison H Nguyen, Doris Bachtrog | <p>Heterochromatin suppresses repetitive DNA, and a loss of heterochromatin has been observed in aged cells of several species, including humans and *Drosophila*. Males often contain substantially more heterochromatic DNA than females, due to the ... | | Bioinformatics & Computational Biology, Expression Studies, Genetic conflicts, Genome Evolution, Genotype-Phenotype, Molecular Evolution, Reproduction and Sex | Gabriel Marais | 2020-07-28 15:06:18 | ||
30 May 2023
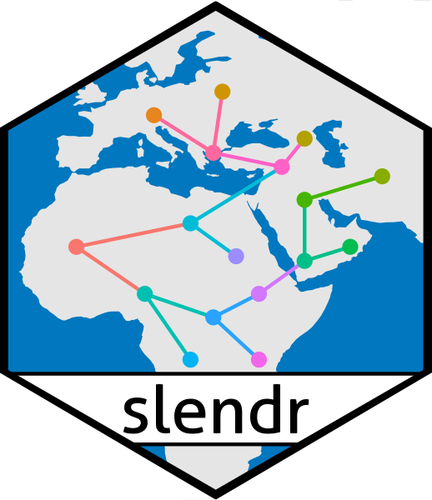
slendr: a framework for spatio-temporal population genomic simulations on geographic landscapesA new powerful tool to easily encode the geo-spatial dimension in population genetics simulationsRecommended by Emiliano Trucchi based on reviews by Liisa Loog and 2 anonymous reviewers
Models explaining the evolutionary processes operating in living beings are often impossible to test in the real world. This is mainly because of the long time (i.e., the number of generations) which is necessary for evolution to unfold. In addition, any such experiment would require a large number of individuals and, more importantly, many replicates to account for the inherent variance of the evolutionary processes under investigation. Only organisms with fast generation times and favourable rearing conditions can be used to explicitly test for specific evolutionary hypotheses. Computer simulations have filled this gap, revolutionising experimental testing in evolutionary biology by integrating genetic models into complex population dynamics, which can be run for (potentially) any length of time. Without going into an extensive description of the many available approaches for population genetics simulations (an exhaustive review can be found in Hoban et al 2012), three main aspects are, in my opinion, important for categorising and choosing one simulation approach over another. The first concerns the basic distinction between coalescent-based and individual-based simulators: the former being an efficient approach, which simulates back in time the coalescence events of a sample of homologous DNA fragments, while the latter is a more computationally intensive approach where all of the individuals (and their underlying genetic/genomic features) in the population are simulated forward-in-time, generation after generation. The second aspect concerns the simulation of natural selection. Although natural selection can be integrated into backward-in-time simulations, it is more realistically implemented as individual-based fitness in forward-in-time simulators. The third point, which has been often overlooked in evolutionary simulations, is about the possibility to design a simulation scenario where individuals and populations can exploit a physical (geographical) space. Amongst the coalescent-based simulators, SPLATCHE (Currat et al 2004), and its derivatives, is one of the few simulation tools deploying the coalescence process in sub-demes which are all connected by migration, thus getting as close as possible to a spatially-explicit population. On the other hand, individual-based simulators, whose development followed the increasing power of computational machines, offer a great opportunity to include spatio-temporal dynamics within a genomic simulation model. One of the most realistic and efficient individual-based forward-in-time simulators available is SLiM (Haller and Messer 2017), which allows users to implement simulations in arbitrarily complex spaces. Here, the more challenging part is encoding the spatially-explicit scenarios using the SLiM-specific EIDOS language. The new R package slendr (Petr et al 2022) offers a practical solution to this issue. By wrapping different tools into a well-known scripting language, slendr allows the design of spatiotemporal simulation scenarios which can be directly executed in the individual-based SLiM simulator, and the output stored with modern tree-sequence analysis tools (tskit; Kellerer et al 2018). Alternatively, simulations of non-spatial models can be run using a coalescent-based algorithm (msprime; Baumdicker et al 2022). The main advantage of slendr is that the whole simulative experiment can be performed entirely in the R environment, taking advantage of the many libraries available for geospatial and genomic data analysis, statistics, and visualisation. The open-source nature of this package, whose main aim is to make complex population genomics modelling more accessible, and the vibrant community of SLiM and tskit users will very likely make slendr widely used amongst the molecular ecology and evolutionary biology communities. Slendr handles real Earth cartographic data where users can design realistic demographic processes which characterise natural populations (i.e., expansions, displacement of large populations, interactions among populations, migrations, population splits, etc.) by changing spatial population boundaries across time and space. All in all, slendr is a very flexible and scalable framework to test the accuracy of spatial models, hypotheses about demography and selection, and interactions between organisms across space and time. REFERENCES Baumdicker, F., Bisschop, G., Goldstein, D., Gower, G., Ragsdale, A. P., Tsambos, G., ... & Kelleher, J. (2022). Efficient ancestry and mutation simulation with msprime 1.0. Genetics, 220(3), iyab229. https://doi.org/10.1093/genetics/iyab229 Currat, M., Ray, N., & Excoffier, L. (2004). SPLATCHE: a program to simulate genetic diversity taking into account environmental heterogeneity. Molecular Ecology Notes, 4(1), 139-142. https://doi.org/10.1046/j.1471-8286.2003.00582.x Haller, B. C., & Messer, P. W. (2017). SLiM 2: flexible, interactive forward genetic simulations. Molecular biology and evolution, 34(1), 230-240. https://doi.org/10.1093/molbev/msw211 Hoban, S., Bertorelle, G., & Gaggiotti, O. E. (2012). Computer simulations: tools for population and evolutionary genetics. Nature Reviews Genetics, 13(2), 110-122. https://doi.org/10.1038/nrg3130 Kelleher, J., Thornton, K. R., Ashander, J., & Ralph, P. L. (2018). Efficient pedigree recording for fast population genetics simulation. PLoS computational biology, 14(11), e1006581. https://doi.org/10.1371/journal.pcbi.1006581 Petr, M., Haller, B. C., Ralph, P. L., & Racimo, F. (2023). slendr: a framework for spatio-temporal population genomic simulations on geographic landscapes. bioRxiv, 2022.03.20.485041, ver. 5 peer-reviewed and recommended by Peer Community in Evolutionary Biology. https://doi.org/10.1101/2022.03.20.485041 | slendr: a framework for spatio-temporal population genomic simulations on geographic landscapes | Martin Petr, Benjamin C. Haller, Peter L. Ralph, Fernando Racimo | <p style="text-align: justify;">One of the goals of population genetics is to understand how evolutionary forces shape patterns of genetic variation over time. However, because populations evolve across both time and space, most evolutionary proce... | | Bioinformatics & Computational Biology, Evolutionary Theory, Phylogeography & Biogeography, Population Genetics / Genomics | Emiliano Trucchi | 2022-09-14 12:57:56 | ||
31 Mar 2022
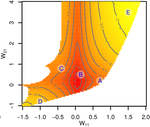
Gene network robustness as a multivariate characterGenetic and environmental robustness are distinct yet correlated evolvable traits in a gene networkRecommended by Frédéric Guillaume based on reviews by Diogo Melo, Charles Mullon and Charles Rocabert
Organisms often show robustness to genetic or environmental perturbations. Whether these two components of robustness can evolve separately is the focus of the paper by Le Rouzic [1]. Using theoretical analysis and individual-based computer simulations of a gene regulatory network model, he shows that multiple aspects of robustness can be investigated as a set of pleiotropically linked quantitative traits. While genetically correlated, various robustness components (e.g., mutational, developmental, homeostasis) of gene expression in the regulatory network evolved more or less independently from each other under directional selection. The quantitative approach of Le Rouzic could explain both how unselected robustness components can respond to selection on other components and why various robustness-related features seem to have their own evolutionary history. Moreover, he shows that all components were evolvable, but not all to the same extent. Robustness to environmental disturbances and gene expression stability showed the largest responses while increased robustness to genetic disturbances was slower. Interestingly, all components were positively correlated and remained so after selection for increased or decreased robustness. This study is an important contribution to the discussion of the evolution of robustness in biological systems. While it has long been recognized that organisms possess the ability to buffer genetic and environmental perturbations to maintain homeostasis (e.g., canalization [2]), the genetic basis and evolutionary routes to robustness and canalization are still not well understood. Models of regulatory gene networks have often been used to address aspects of robustness evolution (e.g., [3]). Le Rouzic [1] used a gene regulatory network model derived from Wagner’s model [4]. The model has as end product the expression level of a set of genes influenced by a set of regulatory elements (e.g., transcription factors). The level and stability of expression are a property of the regulatory interactions in the network. Le Rouzic made an important contribution to the study of such gene regulation models by using a quantitative genetics approach to the evolution of robustness. He crafted a way to assess the mutational variability and selection response of the components of robustness he was interested in. Le Rouzic’s approach opens avenues to investigate further aspects of gene network evolutionary properties, for instance to understand the evolution of phenotypic plasticity. Le Rouzic also discusses ways to measure his different robustness components in empirical studies. As the model is about gene expression levels at a set of protein-coding genes influenced by a set of regulatory elements, it naturally points to the possibility of using RNA sequencing to measure the variation of gene expression in know gene networks and assess their robustness. Robustness could then be studied as a multidimensional quantitative trait in an experimental setting. References [1] Le Rouzic, A (2022) Gene network robustness as a multivariate character. arXiv: 2101.01564, ver. 5 peer-reviewed and recommended by Peer Community in Evolutionary Biology. https://arxiv.org/abs/2101.01564 [2] Waddington CH (1942) Canalization of Development and the Inheritance of Acquired Characters. Nature, 150, 563–565. https://doi.org/10.1038/150563a0 [3] Draghi J, Whitlock M (2015) Robustness to noise in gene expression evolves despite epistatic constraints in a model of gene networks. Evolution, 69, 2345–2358. https://doi.org/10.1111/evo.12732 [4] Wagner A (1994) Evolution of gene networks by gene duplications: a mathematical model and its implications on genome organization. Proceedings of the National Academy of Sciences, 91, 4387–4391. https://doi.org/10.1073/pnas.91.10.4387 | Gene network robustness as a multivariate character | Arnaud Le Rouzic | <p style="text-align: justify;">Robustness to genetic or environmental disturbances is often considered as a key property of living systems. Yet, in spite of being discussed since the 1950s, how robustness emerges from the complexity of genetic ar... | | Bioinformatics & Computational Biology, Evolutionary Theory, Genotype-Phenotype, Quantitative Genetics | Frédéric Guillaume | Charles Mullon, Charles Rocabert, Diogo Melo | 2021-01-11 17:48:20 | |
05 Jun 2018
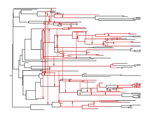
The dynamics of preferential host switching: host phylogeny as a key predictor of parasite prevalence and distributionShift or stick? Untangling the signatures of biased host switching, and host-parasite co-speciationRecommended by Lucy Weinert based on reviews by Damien de Vienne and Nathan MeddMany emerging diseases arise by parasites switching to new host species, while other parasites seem to remain with same host lineage for very long periods of time, even over timescales where an ancestral host species splits into two or more new species. The ability to understand these dynamics would form an important part of our understanding of infectious disease. Experiments are clearly important for understanding these processes, but so are comparative studies, investigating the variation that we find in nature. Such comparative data do show strong signs of non-randomness, and this suggests that the epidemiological and ecological processes might be predictable, at least in part. For example, when we map patterns of parasite presence/absence onto host phylogenies, we often find that certain host clades harbour many more parasites than expected, or that closely-related hosts harbour closely-related parasites. Nevertheless, it remains difficult to interpret these patterns to make inferences about ecological and epidemiological processes. This is partly because non-random associations can arise in multiple ways. For example, parasites might be inherited from the common ancestor of related hosts, or might switch to new hosts, but preferentially establish on novel hosts that are closely related to their existing host. Infection might also influence the shape of host phylogeny, either by increasing the rate of host extinction or, conversely, increasing the rate of speciation (as with manipulative symbionts that might induce reproductive isolation). These various processes have, by and large, been studied in isolation, but the model introduced by Engelstädter and Fortuna [1], makes an important first step towards studying them together. Without such combined analyses, we will not be able to tell if the processes have their own unique signatures, or whether the same sort of non-randomness can arise in multiple ways. A major finding of the work is that the size of a host clade can be an important determinant of its overall infection level. This had been shown in previous work, assuming that the host phylogeny was fixed, but the current paper shows that it extends also to situations where host extinction and speciation takes place at a comparable rate to host shifting. This finding, then, calls into question the natural assumption that a clade of host species that is highly parasite ridden, must have some genetic or ecological characteristic that makes them particularly prone to infection, arguing that the clade size, rather than any characteristic of the clade members, might be the important factor. It will be interesting to see whether this prediction about clade size is borne out with comparative studies. Another feature of the study is that the framework is naturally extendable, to include further processes, such as the influence of parasite presence on extinction or speciation rates. No doubt extensions of this kind will form the basis of important future work. References [1] Engelstädter J and Fortuna NZ. 2018. The dynamics of preferential host switching: host phylogeny as a key predictor of parasite prevalence and distribution. bioRxiv 209254 ver. 5 peer-reviewed by Peer Community In Evolutionary Biology. doi: 10.1101/209254 | The dynamics of preferential host switching: host phylogeny as a key predictor of parasite prevalence and distribution | Jan Engelstaedter & Nicole Fortuna | <p>New parasites commonly arise through host-shifts, where parasites from one host species jump to and become established in a new host species. There is much evidence that the probability of host-shifts decreases with increasing phylogenetic dist... | | Bioinformatics & Computational Biology, Evolutionary Epidemiology, Evolutionary Theory, Macroevolution, Phylogenetics / Phylogenomics, Species interactions | Lucy Weinert | 2017-10-30 02:06:06 | ||
11 Oct 2022
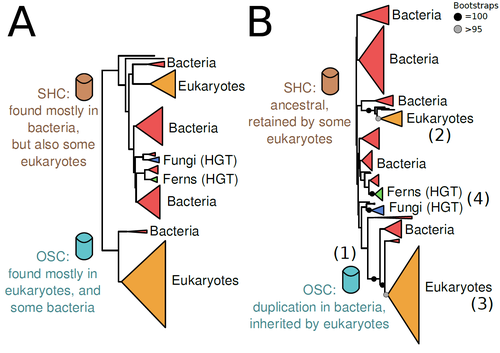
The Eukaryotic Last Common Ancestor Was Bifunctional for Hopanoid and Sterol ProductionGene family analysis suggests new evolutionary scenario for sterol and hopanoid biomarkersRecommended by Iker Irisarri based on reviews by Samuel Abalde, Denis Baurain and Jose Ramon Pardos-BlasSterols and hopanoids are sometimes used as biomarkers to infer the origin of certain groups of organisms. Traditionally, hopanoid-derived products in ancient rocks have been considered to indicate the presence of bacteria, whereas sterol derivatives have been considered to be exclusive to eukaryotes. However, a closer look at the topic reveals a rather complex distribution of either compound in both bacteria and eukaryotes. (1). The known biosynthetic pathways for sterols and hopanoids are similar but diverge at a critical step where two different enzymes are used: squalene-hopene cyclase (SHC) and oxidosqualene cyclase (OSC), the latter requiring oxygen. These two enzymes belong to the same gene family, whose complex evolutionary history is difficult to reconcile with the known species phylogeny. In this study (2), Dr. Warren R. Francis revisits the evolution of this gene family using an extended dataset with a broader taxonomic representation. In contrast to the traditional representation of the tree rooted between SHC and OSC paralogs (i.e., based on function), the author proposes that rooting the tree within bacterial SHCs and assuming a secondary origin of OSC is more parsimonious. This postulates SHC to be the ancestral function –retained in many extant bacteria and some eukaryotes– and OSC to have emerged later within bacteria –currently being mostly present in eukaryotes–. The reconstructed evolutionary history is arguably complex and can only be reconciled with the species' phylogeny by invoking many secondary losses. These losses are considered likely because many extant species acquire sterols and hopanoids by diet and lack one or both enzymes. Some cases of recent horizontal gene transfer are also proposed. In contrast to the dichotomy between bacterial SHCs and eukaryote OSCs, the new proposed scenario suggests that the eukaryote ancestor likely inherited both enzymes from bacteria and thus could be able to synthesize both sterols and hopanoids. Under this hypothesis, not only bacteria but also eukaryotes could be responsible for the hopane found in old rocks. This agrees with eukaryote fossils dating back to more than 1 billion years ago (3). Also, the observed increase of sterane levels in rocks ~600-700 million years old cannot be associated with the origin of eukaryotes, which is a much older event, but could rather reflect changes in atmospheric oxygen levels because oxygen is required for the synthesis of sterols by OSC. References 1. Santana-Molina C, Rivas-Marin E, Rojas AM, Devos DP (2020) Origin and Evolution of Polycyclic Triterpene Synthesis. Molecular Biology and Evolution, 37, 1925–1941. https://doi.org/10.1093/molbev/msaa054 2. Francis WR (2022) The Eukaryotic Last Common Ancestor Was Bifunctional for Hopanoid and Sterol Production. Preprints, 2020040186, ver. 5 peer-reviewed and recommended by Peer Community in Evolutionary Biology. https://doi.org/10.20944/preprints202004.0186.v5 3. Butterfield NJ (2000) Bangiomorpha pubescens n. gen., n. sp.: implications for the evolution of sex, multicellularity, and the Mesoproterozoic/Neoproterozoic radiation of eukaryotes. Paleobiology, 26, 386–404. https://doi.org/10.1666/0094-8373(2000)026<0386:BPNGNS>2.0.CO;2 | The Eukaryotic Last Common Ancestor Was Bifunctional for Hopanoid and Sterol Production | Warren R Francis | <p>Steroid and hopanoid biomarkers can be found in ancient rocks and may give a glimpse of what life was present at that time. Sterols and hopanoids are produced by two related enzymes, though the evolutionary history of this protein family is com... | | Bioinformatics & Computational Biology, Evolutionary Ecology, Molecular Evolution, Paleontology, Phylogenetics / Phylogenomics | Iker Irisarri | 2021-01-13 16:03:29 | ||
23 Jan 2020

A novel workflow to improve multi-locus genotyping of wildlife species: an experimental set-up with a known model systemImproving the reliability of genotyping of multigene families in non-model organismsRecommended by François Rousset based on reviews by Sebastian Ernesto Ramos-Onsins, Helena Westerdahl and Thomas BigotThe reliability of published scientific papers has been the topic of much recent discussion, notably in the biomedical sciences [1]. Although small sample size is regularly pointed as one of the culprits, big data can also be a concern. The advent of high-throughput sequencing, and the processing of sequence data by opaque bioinformatics workflows, mean that sequences with often high error rates are produced, and that exact but slow analyses are not feasible. References [1] Ioannidis, J. P. A, Greenland, S., Hlatky, M. A., Khoury, M. J., Macleod, M. R., Moher, D., Schulz, K. F. and Tibshirani, R. (2014) Increasing value and reducing waste in research design, conduct, and analysis. The Lancet, 383, 166-175. doi: 10.1016/S0140-6736(13)62227-8 | A novel workflow to improve multi-locus genotyping of wildlife species: an experimental set-up with a known model system | Gillingham, Mark A. F., Montero, B. Karina, Wilhelm, Kerstin, Grudzus, Kara, Sommer, Simone and Santos, Pablo S. C. | <p>Genotyping novel complex multigene systems is particularly challenging in non-model organisms. Target primers frequently amplify simultaneously multiple loci leading to high PCR and sequencing artefacts such as chimeras and allele amplification... | | Bioinformatics & Computational Biology, Evolutionary Ecology, Genome Evolution, Molecular Evolution | François Rousset | Helena Westerdahl, Sebastian Ernesto Ramos-Onsins, Paul J. McMurdie , Arnaud Estoup, Vincent Segura, Jacek Radwan , Torbjørn Rognes , William Stutz , Kevin Vanneste , Thomas Bigot, Jill A. Hollenbach , Wieslaw Babik , Marie-Christin... | 2019-05-15 17:30:44 | |
16 May 2023
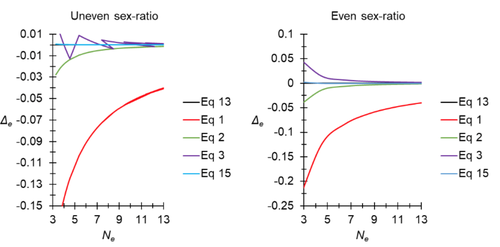
A new and almost perfectly accurate approximation of the eigenvalue effective population size of a dioecious population: comparisons with other estimates and detailed proofsAll you ever wanted to know about Ne in one handy placeRecommended by Charles Baer based on reviews by Jesse ("Jay") Taylor and 1 anonymous reviewerOf the four evolutionary forces, three can be straightforwardly summarized both conceptually and mathematically in the context of an allele at a genomic locus. Mutation (the mutation rate, μ) is simply captured by the per-site, per-generation probability that an allele mutates into a different allele. Recombination (the recombination rate, r) is captured as the probability of recombination between two sites, wherein alleles that are in different genomes in one generation come together in the same genome in the next generation. Natural selection (the selection coefficient, s) is captured by the probability that an allele is present in the next generation, relative to some reference. Random genetic drift – the random fluctuation in allele frequency due to sampling in a finite population - is not so straightforwardly summarized. The first, and most common way of characterizing evolutionary dynamics in a finite population is the Wright-Fisher model, in which the only deviation from the assumptions of Hardy-Weinberg conditions is finite population size. Importantly, in a W-F population, mating between diploid individuals is random, which implies self-fertile monoecy, and generations are non-overlapping. In an ideal W-F population, the probability that a gene copy leaves i descendants in the next generation is the result of binomial sampling of uniting gametes (if the locus is biallelic). The – and the next word is meaningful – magnitude/strength/rate/power/amount of genetic drift is proportional to 1/2N, where N is the size of the population. All of the following are affected by genetic drift: (1) the probability that a neutral allele ultimately reaches fixation, (2) the rate of loss of genetic variation within a population, (3) the rate of increase of genetic variance among populations, (4) the amount of genetic variation segregating in a population, (5) the probability of fixation/loss of a weakly selected variant. Presumably no real population adheres to ideal W-F conditions, which leads to the notion of "effective population size", Ne (Wright 1931), loosely defined as "the size of an ideal W-F population that experiences an equivalent strength of genetic drift". Almost always, Ne<N, and any violation of W-F assumptions can affect Ne. Importantly, Ne can be defined in different ways, and the specific formulation of Ne can have different implications for evolution. Ne was initially defined in terms of the rate of decrease of heterozygosity (inbreeding effective size) and increase in variance among populations (variance effective size). Ewens (1979) defined the Eigenvalue effective size (equivalent to the "random extinction" effective size) and elaborated on the conditions under which the various formulations of Ne differ (Ewens 1982). Nordborg and Krone (2002) defined the effective size in terms of the coalescent, and they identified conditions in which genetic drift cannot be described in terms of a W-F model (Sjodin et al. 2005); also see Karasov et al. (2010); Neher and Shraiman (2011). Distinct from the issue of defining Ne is the issue of calculating Ne from data, which is the focus of this paper by De Meeus and Noûs (2023). Pudovkin et al. (1996) showed that the Eigenvalue effective size in a dioecious population can be formulated in terms of excess heterozygosity, which the current authors note is equivalent to formulating Ne in terms of Wright's FIS statistic. As emphasized by the title, the marquee contribution of this paper is to provide a better approximation of the Eigenvalue effective size in a dioecious population. Science marches onward, although the empirical utility of this advance is obviously limited, given the tremendous inherent sources of uncertainty in real-world estimates of Ne. Perhaps more valuable, however, is the extensive set of appendixes, in which detailed derivations are provided for the various formulations of effective size. By way of analogy, the material presented here can be thought of as an extension of the material presented in section 7.6 of Crow and Kimura (1970), in which the Inbreeding and Variance effective population sizes are derived and compared. The appendixes should serve as a handy go-to source of detailed theoretical information with respect to the different formulations of effective population size. REFERENCES Crow, J. F. and M. Kimura. 1970. An Introduction to Population Genetics Theory. The Blackburn Press, Caldwell, NJ. De Meeûs, T. and Noûs, C. 2023. A new and almost perfectly accurate approximation of the eigenvalue effective population size of a dioecious population: comparisons with other estimates and detailed proofs. Zenodo, ver. 6 peer-reviewed and recommended by Peer Community in Evolutionary Biology. https://doi.org/10.5281/zenodo.7927968 Ewens, W. J. 1979. Mathematical Population Genetics. Springer-Verlag, Berlin. Ewens, W. J. 1982. On the concept of the effective population size. Theoretical Population Biology 21:373-378. https://doi.org/10.1016/0040-5809(82)90024-7 Karasov, T., P. W. Messer, and D. A. Petrov. 2010. Evidence that adaptation in Drosophila Is not limited by mutation at single sites. Plos Genetics 6. https://doi.org/10.1371/journal.pgen.1000924 Neher, R. A. and B. I. Shraiman. 2011. Genetic Draft and Quasi-Neutrality in Large Facultatively Sexual Populations. Genetics 188:975-U370. https://doi.org/10.1534/genetics.111.128876 Nordborg, M. and S. M. Krone. 2002. Separation of time scales and convergence to the coalescent in structured populations. Pp. 194–232 in M. Slatkin, and M. Veuille, eds. Modern Developments in Theoretical Population Genetics: The Legacy of Gustave Malécot. Oxford University Press, Oxford. https://www.webpages.uidaho.edu/~krone/malecot.pdf Pudovkin, A. I., D. V. Zaykin, and D. Hedgecock. 1996. On the potential for estimating the effective number of breeders from heterozygote-excess in progeny. Genetics 144:383-387. https://doi.org/10.1093/genetics/144.1.383 Sjodin, P., I. Kaj, S. Krone, M. Lascoux, and M. Nordborg. 2005. On the meaning and existence of an effective population size. Genetics 169:1061-1070. https://doi.org/10.1534/genetics.104.026799 Wright, S. 1931. Evolution in Mendelian populations. Genetics 16:0097-0159. https://doi.org/10.1093/genetics/16.2.97 | A new and almost perfectly accurate approximation of the eigenvalue effective population size of a dioecious population: comparisons with other estimates and detailed proofs | Thierry de Meeûs and Camille Noûs | <p>The effective population size is an important concept in population genetics. It corresponds to a measure of the speed at which genetic drift affects a given population. Moreover, this is most of the time the only kind of population size that e... | | Bioinformatics & Computational Biology, Evolutionary Ecology, Evolutionary Theory, Population Genetics / Genomics, Reproduction and Sex | Charles Baer | 2023-02-22 16:53:49 | ||
30 Aug 2021
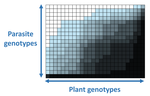
The quasi-universality of nestedness in the structure of quantitative plant-parasite interactionsNestedness and modularity in plant-parasite infection networksRecommended by Santiago Elena based on reviews by Rubén González and 2 anonymous reviewers
In a landmark paper, Flores et al. (2011) showed that the interactions between bacteria and their viruses could be nicely described using a bipartite infection networks. Two quantitative properties of these networks were of particular interest, namely modularity and nestedness. Modularity emerges when groups of host species (or genotypes) shared groups of viruses. Nestedness provided a view of the degree of specialization of both partners: high nestedness suggests that hosts differ in their susceptibility to infection, with some highly susceptible host genotypes selecting for very specialized viruses while strongly resistant host genotypes select for generalist viruses. Translated to the plant pathology parlance, this extreme case would be equivalent to a gene-for-gene infection model (Flor 1956): new mutations confer hosts with resistance to recently evolved viruses while maintaining resistance to past viruses. Likewise, virus mutations for expanding host range evolve without losing the ability to infect ancestral host genotypes. By contrast, a non-nested network would represent a matching-allele infection model (Frank 2000) in which each interacting organism evolves by losing its capacity to resist/infect its ancestral partners, resembling a Red Queen dynamic. Obviously, the reality is more complex and may lie anywhere between these two extreme situations. Recently, Valverde et al. (2020) developed a model to explain the emergence of nestedness and modularity in plant-virus infection networks across diverse habitats. They found that local modularity could coexist with global nestedness and that intraspecific competition was the main driver of the evolution of ecosystems in a continuum between nested-modular and nested networks. These predictions were tested with field data showing the association between plant host species and different viruses in different agroecosystems (Valverde et al. 2020). The effect of interspecific competition in the structure of empirical plant host-virus infection networks was also tested by McLeish et al. (2019). Besides data from agroecosystems, evolution experiments have also shown the pervasive emergence of nestedness during the diversification of independently-evolved lineages of potyviruses in Arabidopsis thaliana genotypes that differ in their susceptibility to infection (Hillung et al. 2014; González et al. 2019; Navarro et al. 2020). In their study, Moury et al. (2021) have expanded all these previous observations to a diverse set of pathosystems that range from viruses, bacteria, oomycetes, fungi, nematodes to insects. While modularity was barely seen in only a few of the systems, nestedness was a common trend (observed in ~94% of all systems). This nestedness, as seen in previous studies and as predicted by theory, emerged as a consequence of the existence of generalist and specialist strains of the parasites that differed in their capacity to infect more or less resistant plant genotypes. As pointed out by Moury et al. (2021) in their conclusions, the ubiquity of nestedness in plant-parasite infection matrices has strong implications for the evolution and management of infectious diseases. References Flor, H. H. (1956). The complementary genic systems in flax and flax rust. In Advances in genetics, 8, 29-54. https://doi.org/10.1016/S0065-2660(08)60498-8 Flores, C. O., Meyer, J. R., Valverde, S., Farr, L., and Weitz, J. S. (2011). Statistical structure of host–phage interactions. Proceedings of the National Academy of Sciences, 108, E288-E297. https://doi.org/10.1073/pnas.1101595108 Frank, S. A. (2000). Specific and non-specific defense against parasitic attack. Journal of Theoretical Biology, 202, 283-304. https://doi.org/10.1006/jtbi.1999.1054 González, R., Butković, A., and Elena, S. F. (2019). Role of host genetic diversity for susceptibility-to-infection in the evolution of virulence of a plant virus. Virus evolution, 5(2), vez024. https://doi.org/10.1093/ve/vez052 Hillung, J., Cuevas, J. M., Valverde, S., and Elena, S. F. (2014). Experimental evolution of an emerging plant virus in host genotypes that differ in their susceptibility to infection. Evolution, 68, 2467-2480. https://doi.org/10.1111/evo.12458 McLeish, M., Sacristán, S., Fraile, A., and García-Arenal, F. (2019). Coinfection organizes epidemiological networks of viruses and hosts and reveals hubs of transmission. Phytopathology, 109, 1003-1010. https://doi.org/10.1094/PHYTO-08-18-0293-R Moury B, Audergon J-M, Baudracco-Arnas S, Krima SB, Bertrand F, Boissot N, Buisson M, Caffier V, Cantet M, Chanéac S, Constant C, Delmotte F, Dogimont C, Doumayrou J, Fabre F, Fournet S, Grimault V, Jaunet T, Justafré I, Lefebvre V, Losdat D, Marcel TC, Montarry J, Morris CE, Omrani M, Paineau M, Perrot S, Pilet-Nayel M-L and Ruellan Y (2021) The quasi-universality of nestedness in the structure of quantitative plant-parasite interactions. bioRxiv, 2021.03.03.433745, ver. 4 recommended and peer-reviewed by PCI Evolutionary Biology. https://doi.org/10.1101/2021.03.03.433745 Navarro, R., Ambros, S., Martinez, F., Wu, B., Carrasco, J. L., and Elena, S. F. (2020). Defects in plant immunity modulate the rates and patterns of RNA virus evolution. bioRxiv. doi: https://doi.org/10.1101/2020.10.13.337402 Valverde, S., Vidiella, B., Montañez, R., Fraile, A., Sacristán, S., and García-Arenal, F. (2020). Coexistence of nestedness and modularity in host–pathogen infection networks. Nature ecology & evolution, 4, 568-577. https://doi.org/10.1038/s41559-020-1130-9 | The quasi-universality of nestedness in the structure of quantitative plant-parasite interactions | Moury Benoît, Audergon Jean-Marc, Baudracco-Arnas Sylvie, Ben Krima Safa, Bertrand François, Boissot Nathalie, Buisson Mireille, Caffier Valérie, Cantet Mélissa, Chanéac Sylvia, Constant Carole, Delmotte François, Dogimont Catherine, Doumayrou Jul... | <p>Understanding the relationships between host range and pathogenicity for parasites, and between the efficiency and scope of immunity for hosts are essential to implement efficient disease control strategies. In the case of plant parasites, most... | | Bioinformatics & Computational Biology, Evolutionary Dynamics, Species interactions | Santiago Elena | 2021-03-04 21:23:08 |


