
Latest recommendations

| Id | Title | Authors | Abstract | Picture | Thematic fields▲ | Recommender | Reviewers | Submission date | |
|---|---|---|---|---|---|---|---|---|---|
10 Jan 2020
Probabilities of tree topologies with temporal constraints and diversification shiftsFitting diversification models on undated or partially dated treesRecommended by Nicolas Lartillot based on reviews by Amaury Lambert, Dominik Schrempf and 1 anonymous reviewerPhylogenetic trees can be used to extract information about the process of diversification that has generated them. The most common approach to conduct this inference is to rely on a likelihood, defined here as the probability of generating a dated tree T given a diversification model (e.g. a birth-death model), and then use standard maximum likelihood. This idea has been explored extensively in the context of the so-called diversification studies, with many variants for the models and for the questions being asked (diversification rates shifting at certain time points or in the ancestors of particular subclades, trait-dependent diversification rates, etc). References [1] Didier, G. (2020) Probabilities of tree topologies with temporal constraints and diversification shifts. bioRxiv, 376756, ver. 4 peer-reviewed and recommended by PCI Evolutionary Biology. doi: 10.1101/376756 | Probabilities of tree topologies with temporal constraints and diversification shifts | Gilles Didier | <p>Dating the tree of life is a task far more complicated than only determining the evolutionary relationships between species. It is therefore of interest to develop approaches apt to deal with undated phylogenetic trees. The main result of this ... | | Bioinformatics & Computational Biology, Macroevolution | Nicolas Lartillot | 2019-01-30 11:28:58 | ||
02 May 2023
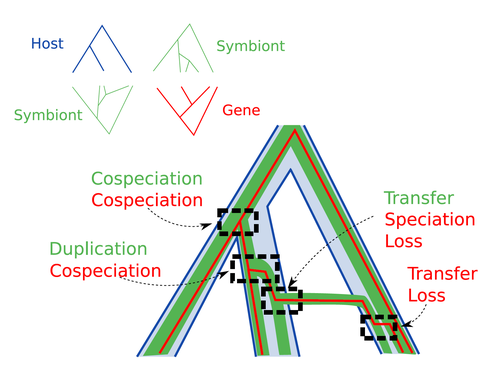
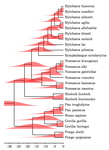
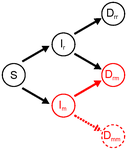
Host-symbiont-gene phylogenetic reconciliationReconciling molecular evolution and evolutionary ecology studies: a phylogenetic reconciliation method for gene-symbiont-host systemsRecommended by Emmanuelle Jousselin based on reviews by Vincent Berry and Catherine MatiasInteractions between species are a driving force in evolution. Many organisms host symbiotic partners that live all or part of their life in or on their host. Whether they are mutualistic or parasitic, these symbiotic associations impose strong selective pressures on both partners and affect their evolutionary trajectories. In fine, they can have a significant impact on the diversification patterns of both host and symbiont lineages, with symbiotic lineages sometimes speciating simultaneously with their hosts and/or switching from one host species to another. Long-term associations between species can also result in gene transfers between the involved organisms. Those lateral gene transfers are a source of ecological innovation but can obscure the phylogenetic signals and render the process of phylogenetic reconstructions complex (Lerat et al. 2003). Methods known as reconciliations explore similarities and differences between phylogenetic trees. They have been widely used to both compare the diversification patterns of hosts and symbionts and identify lateral gene transfers between species. Though the reconciliation approaches used in host/ symbiont and species/ gene phylogenetic studies are identical, they are always applied separately to solve either molecular evolution questions or investigate the evolution of ecological interactions. However, the two questions are often intimately linked and the current interest in multi-level systems (e.g. the holobiont concept) calls for a unique model that will take into account three-level nested organization (gene/symbiont/ host) where both symbiont and genes can transfer among hosts. Here Menet and collaborators (2023) provide such a model to produce three-level reconciliations. In order to do so, they extend the two-level reconciliation model implemented in “ALE” software (Szöllősi et al. 2013), one of the most used and proven reconciliation methods. Briefly, given a symbiont gene tree, a symbiont tree and a host tree, as in previous reconciliation models, the symbiont tree is mapped onto the host tree by mixing three types of events: Duplication, Transfer or Loss (DTL), with a possibility of the symbiont evolving temporarily outside the host phylogeny (in a “ghost” host lineage). The gene tree evolves similarly inside the symbiont tree, but horizontal transfers are constrained to symbionts co-occurring within the same host. Joint reconciliation scenarios are reconstructed and DTL event rates and likelihoods are estimated according to the model. As a nice addition, the authors propose a method to infer the symbiont phylogeny through amalgamation from gene trees and a host tree. The authors then explore the diverse possibilities offered by this method by testing it on both simulated datasets and biological datasets in order to check whether considering three nested levels is worthwhile. They convincingly show that three-level reconciliation has a better capacity to retrieve the symbiont donors and receivers of horizontal gene transfers, probably because transfers are constrained by additional elements relevant to the biological systems. Using, aphids, their obligate endosymbionts, and the symbiont genes involved in their nutritional functions, they identify horizontal gene transfers between aphid symbionts that are missed by two-level reconciliations but detected by expertise (Manzano-Marín et al. 2020). The other dataset presented here is on the human pathogen Helicobacter pylori, which history is supposed to reflect human migration. They use more than 1000 H. pylori gene families, and four populations, and use likelihood computations to compare different hypotheses on the diversification of the host. In summary, this study is a proof-of-concept of a 3-level reconciliation, where the authors manage to convey the applicability of their framework to many biological systems. Reported complexities, confirmed by reported running times, show that the method is computationally efficient. Without a doubt, the tool presented here will be very useful to evolutionary biologists who want to investigate multi-scale cophylogenies and it will move forward the study of associations between host and symbionts when symbiont genomic data are available. REFERENCES Lerat, E., Daubin, V., & Moran, N. A. (2003). From gene trees to organismal phylogeny in prokaryotes: the case of the γ-Proteobacteria. PLoS biology, 1(1), e19. Menet H, Trung AN, Daubin V, Tannier E (2023) Host-symbiont-gene phylogenetic reconciliation. bioRxiv, 2022.07.01.498457, ver. 2 peer-reviewed and recommended by Peer Community in Evolutionary Biology. https://doi.org/10.1101/2022.07.01.498457 Szöllősi, G. J., Rosikiewicz, W., Boussau, B., Tannier, E., & Daubin, V. (2013). Efficient exploration of the space of reconciled gene trees. Systematic biology, 62(6), 901-912. | Host-symbiont-gene phylogenetic reconciliation | Hugo Menet, Alexia Nguyen Trung, Vincent Daubin, Eric Tannier | <p style="text-align: justify;"><strong>Motivation:</strong> Biological systems are made of entities organized at different scales e.g. macro-organisms, symbionts, genes...) which evolve in interaction.<br>These interactions range from indepe... | | Bioinformatics & Computational Biology, Phylogenetics / Phylogenomics | Emmanuelle Jousselin | 2022-08-21 18:34:27 | ||
04 Mar 2021
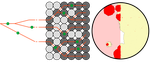
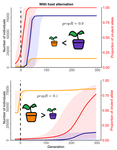
Simulation of bacterial populations with SLiMSimulating bacterial evolution forward-in-timeRecommended by Frederic Bertels based on reviews by 3 anonymous reviewersJean Cury and colleagues (2021) have developed a protocol to simulate bacterial evolution in SLiM. In contrast to existing methods that depend on the coalescent, SLiM simulates evolution forward in time. SLiM has, up to now, mostly been used to simulate the evolution of eukaryotes (Haller and Messer 2019), but has been adapted here to simulate evolution in bacteria. Forward-in-time simulations are usually computationally very costly. To circumvent this issue, bacterial population sizes are scaled down. One would now expect results to become inaccurate, however, Cury et al. show that scaled-down forwards simulations provide very accurate results (similar to those provided by coalescent simulators) that are consistent with theoretical expectations. Simulations were analyzed and compared to existing methods in simple and slightly more complex scenarios where recombination affects evolution. In all scenarios, simulation results from coalescent methods (fastSimBac (De Maio and Wilson 2017), ms (Hudson 2002)) and scaled-down forwards simulations were very similar, which is very good news indeed. A biologist not aware of the complexities of forwards, backwards simulations and the coalescent, might now naïvely ask why another simulation method is needed if existing methods perform just as well. To address this question the manuscript closes with a very neat example of what exactly is possible with forwards simulations that cannot be achieved using existing methods. The situation modeled is the growth and evolution of a set of 50 bacteria that are randomly distributed on a petri dish. One side of the petri dish is covered in an antibiotic the other is antibiotic-free. Over time, the bacteria grow and acquire antibiotic resistance mutations until the entire artificial petri dish is covered with a bacterial lawn. This simulation demonstrates that it is possible to simulate extremely complex (e.g. real world) scenarios to, for example, assess whether certain phenomena are expected with our current understanding of bacterial evolution, or whether there are additional forces that need to be taken into account. Hence, forwards simulators could significantly help us to understand what current models can and cannot explain in evolutionary biology.
References Cury J, Haller BC, Achaz G, Jay F (2021) Simulation of bacterial populations with SLiM. bioRxiv, 2020.09.28.316869, version 5 peer-reviewed and recommended by Peer community in Evolutionary Biology. https://doi.org/10.1101/2020.09.28.316869 De Maio N, Wilson DJ (2017) The Bacterial Sequential Markov Coalescent. Genetics, 206, 333–343. https://doi.org/10.1534/genetics.116.198796 Haller BC, Messer PW (2019) SLiM 3: Forward Genetic Simulations Beyond the Wright–Fisher Model. Molecular Biology and Evolution, 36, 632–637. https://doi.org/10.1093/molbev/msy228 Hudson RR (2002) Generating samples under a Wright–Fisher neutral model of genetic variation. Bioinformatics, 18, 337–338. https://doi.org/10.1093/bioinformatics/18.2.337 | Simulation of bacterial populations with SLiM | Jean Cury, Benjamin C. Haller, Guillaume Achaz, and Flora Jay | <p>Simulation of genomic data is a key tool in population genetics, yet, to date, there is no forward-in-time simulator of bacterial populations that is both computationally efficient and adaptable to a wide range of scenarios. Here we demonstrate... | | Bioinformatics & Computational Biology, Population Genetics / Genomics | Frederic Bertels | 2020-10-02 19:03:42 | ||
13 Apr 2023
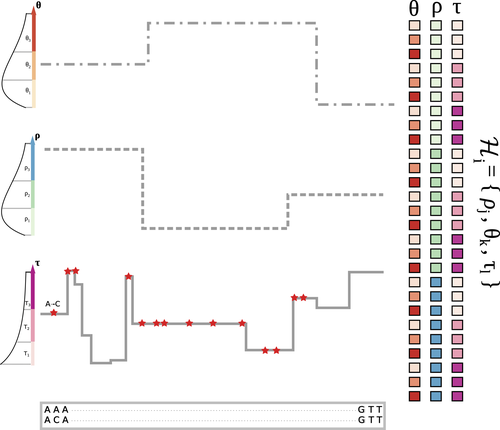
The landscape of nucleotide diversity in Drosophila melanogaster is shaped by mutation rate variationAn unusual suspect: the mutation landscape as a determinant of local variation in nucleotide diversityRecommended by Fernando Racimo based on reviews by David Castellano and 1 anonymous reviewerSometimes, important factors for explaining biological processes fall through the cracks, and it is only through careful modeling that their importance eventually comes out to light. In this study, Barroso and Dutheil introduce a new method based on the sequentially Markovian coalescent (SMC, Marjoran and Wall 2006) for jointly estimating local recombination and coalescent rates along a genome. Unlike previous SMC-based methods, however, their method can also co-estimate local patterns of variation in mutation rates. This is a powerful improvement which allows them to tackle questions about the reasons for the extensive variation in nucleotide diversity across the chromosomes of a species - a problem that has plagued the minds of population geneticists for decades (Begun and Aquadro 1992, Andolfatto 2007, McVicker et al., 2009, Pouyet and Gilbert 2021). The authors find that variation in de novo mutation rates appears to be the most important factor in determining nucleotide diversity in Drosophila melanogaster. Though seemingly contradicting previous attempts at addressing this problem (Comeron 2014), they take care to investigate and explain why that might be the case. Barroso and Dutheil have also taken care to carefully explain the details of their new approach and have carried a very thorough set of analyses comparing competing explanations for patterns of nucleotide variation via causal modeling. The reviewers raised several issues involving choices made by the authors in their analysis of variance partitioning, the proper evaluation of the role of linked selection and the recombination rate estimates emerging from their model. These issues have all been extensively addressed by the authors, and their conclusions seem to remain robust. The study illustrates why the mutation landscape should not be ignored as an important determinant of local variation in genetic diversity, and opens up questions about the generalizability of these results to other organisms. REFERENCES Andolfatto, P. (2007). Hitchhiking effects of recurrent beneficial amino acid substitutions in the Drosophila melanogaster genome. Genome research, 17(12), 1755-1762. https://doi.org/10.1101/gr.6691007 Barroso, G. V., & Dutheil, J. Y. (2021). The landscape of nucleotide diversity in Drosophila melanogaster is shaped by mutation rate variation. bioRxiv, 2021.09.16.460667, ver. 3 peer-reviewed and recommended by Peer Community in Evolutionary Biology. https://doi.org/10.1101/2021.09.16.460667 Begun, D. J., & Aquadro, C. F. (1992). Levels of naturally occurring DNA polymorphism correlate with recombination rates in D. melanogaster. Nature, 356(6369), 519-520. https://doi.org/10.1038/356519a0 Comeron, J. M. (2014). Background selection as baseline for nucleotide variation across the Drosophila genome. PLoS Genetics, 10(6), e1004434. https://doi.org/10.1371/journal.pgen.1004434 Marjoram, P., & Wall, J. D. (2006). Fast" coalescent" simulation. BMC genetics, 7, 1-9. https://doi.org/10.1186/1471-2156-7-16 McVicker, G., Gordon, D., Davis, C., & Green, P. (2009). Widespread genomic signatures of natural selection in hominid evolution. PLoS genetics, 5(5), e1000471. https://doi.org/10.1371/journal.pgen.1000471 Pouyet, F., & Gilbert, K. J. (2021). Towards an improved understanding of molecular evolution: the relative roles of selection, drift, and everything in between. Peer Community Journal, 1, e27. https://doi.org/10.24072/pcjournal.16 | The landscape of nucleotide diversity in Drosophila melanogaster is shaped by mutation rate variation | Gustavo V Barroso, Julien Y Dutheil | <p style="text-align: justify;">What shapes the distribution of nucleotide diversity along the genome? Attempts to answer this question have sparked debate about the roles of neutral stochastic processes and natural selection in molecular evolutio... | | Bioinformatics & Computational Biology, Population Genetics / Genomics | Fernando Racimo | 2022-10-30 07:52:07 | ||
08 Nov 2021
Dynamics of sex-biased gene expression over development in the stick insect Timema californicumSex-biased gene expression in an hemimetabolous insect: pattern during development, extent, functions involved, rate of sequence evolution, and comparison with an holometabolous insectRecommended by Nadia Aubin-Horth based on reviews by 2 anonymous reviewersAn individual’s sexual phenotype is determined during development. Understanding which pathways are activated or repressed during the developmental stages leading to a sexually mature individual, for example by studying gene expression and how its level is biased between sexes, allows us to understand the functional aspects of dimorphic phenotypes between the sexes. Several studies have quantified the differences in transcription between the sexes in mature individuals, showing the extent of this sex-bias and which functions are affected. There is, however, less data available on what occurs during the different phases of development leading to this phenotype, especially in species with specific developmental strategies, such as hemimetabolous insects. While many well-studied insects such as the honey bee, drosophila, and butterflies, exhibit an holometabolous development ("holo" meaning "complete" in reference to their drastic metamorphosis from the juvenile to the adult stage), hemimetabolous insects have juvenile stages that look similar to the adult stage (the hemi prefix meaning "half", referring to the more tissue-specific changes during development), as seen in crickets, cockroaches, and stick insects. Learning more about what happens during development in terms of the identity of genes that are sex-biased (are they the same genes at different developmental stages? What are their function? Do they exhibit specific sequence evolution rates? Is one sex over-represented in the sex-biased genes?) and their quantity over developmental time (gradual or abrupt increase in number, if any?) would allow us to better understand the evolution of sexual dimorphism at the gene expression level and how it relates to dimorphism at the organismic level. Djordjevic et al (2021) studied the transcriptome during development in an hemimetabolous stick insect, to improve our knowledge of this type of development, where the organismic phenotype is already mostly present in the early life stages. To do this, they quantified whole-genome gene expression levels in whole insects, using RNA-seq at three different developmental stages. One of the interesting results presented by Djordjevic and colleagues is that the increase in the number of genes that were sex-biased in expression is gradual over the three stages of development studied and it is mostly the same genes that stay sex-biased over time, reflecting the gradual change in phenotypes between hatchlings, juveniles and adults. Furthermore, male-biased genes had faster sequence divergence rates than unbiased genes and that female-biased genes. This new information of sex-bias in gene expression in an hemimetabolous insect allowed the authors to do a comparison of sex-biased genes with what has been found in a well-studied holometabolous insect, Drosophila. The gene expression patterns showed that four times more genes were sex-biased in expression in that species than in stick insects. Furthermore, the increase in the number of sex-biased genes during development was quite abrupt and clearly distinct in the adult stage, a pattern that was not seen in stick insects. As pointed out by the authors, this pattern of a "burst" of sex-biased genes at maturity is more common than the gradual increase seen in stick insects. With this study, we now know more about the evolution of sex-biased gene expression in an hemimetabolous insect and how it relates to their phenotypic dimorphism. Clearly, the next step will be to sample more hemimetabolous species at different life stages, to see how this pattern is widespread or not in this mode of development in insects. References Djordjevic J, Dumas Z, Robinson-Rechavi M, Schwander T, Parker DJ (2021) Dynamics of sex-biased gene expression during development in the stick insect Timema californicum. bioRxiv, 2021.01.23.427895, ver. 6 peer-reviewed and recommended by Peer Community in Evolutionary Biology. https://doi.org/10.1101/2021.01.23.427895 | Dynamics of sex-biased gene expression over development in the stick insect Timema californicum | Jelisaveta Djordjevic, Zoé Dumas, Marc Robinson-Rechavi, Tanja Schwander, Darren James Parker | <p style="text-align: justify;">Sexually dimorphic phenotypes are thought to arise primarily from sex-biased gene expression during development. Major changes in developmental strategies, such as the shift from hemimetabolous to holometabolous dev... | | Evo-Devo, Evolutionary Dynamics, Evolutionary Ecology, Expression Studies, Genotype-Phenotype, Molecular Evolution, Reproduction and Sex, Sexual Selection | Nadia Aubin-Horth | 2021-04-22 17:36:32 | ||
18 Dec 2017
Co-evolution of virulence and immunosuppression in multiple infectionsTwo parasites, virulence and immunosuppression: how does the whole thing evolve?Recommended by Sara Magalhaes based on reviews by 2 anonymous reviewersHow parasite virulence evolves is arguably the most important question in both the applied and fundamental study of host-parasite interactions. Typically, this research area has been progressing through the formalization of the problem via mathematical modelling. This is because the question is a complex one, as virulence is both affected and affects several aspects of the host-parasite interaction. Moreover, the evolution of virulence is a problem in which ecology (epidemiology) and evolution (changes in trait values through time) are tightly intertwined, generating what is now known as eco-evolutionary dynamics. Therefore, intuition is not sufficient to address how virulence may evolve. References [1] Anderson RM and May RM. 1982. Coevolution of hosts and parasites. Parasitology, 1982. 85: 411–426. doi: 10.1017/S0031182000055360 [2] Kamiya T, Mideo N and Alizon S. 2017. Coevolution of virulence and immunosuppression in multiple infections. bioRxiv, ver. 7 peer-reviewed by PCI Evol Biol, 149211. doi: 10.1101/139147 | Co-evolution of virulence and immunosuppression in multiple infections | Tsukushi Kamiya, Nicole Mideo, Samuel Alizon | Many components of the host-parasite interaction have been shown to affect the way virulence, that is parasite induced harm to the host, evolves. However, co-evolution of multiple traits is often neglected. We explore how an immunosuppressive mech... | | Evolutionary Applications, Evolutionary Dynamics, Evolutionary Ecology, Evolutionary Epidemiology, Evolutionary Theory | Sara Magalhaes | 2017-06-13 16:49:45 | ||
16 Dec 2020
Shifts from pulled to pushed range expansions caused by reduction of landscape connectivityThe push and pull between theory and data in understanding the dynamics of invasionRecommended by Ben Phillips based on reviews by Laura Naslund and 2 anonymous reviewersExciting times are afoot for those of us interested in the ecology and evolution of invasive populations. Recent years have seen evolutionary process woven firmly into our understanding of invasions (Miller et al. 2020). This integration has inspired a welter of empirical and theoretical work. We have moved from field observations and verbal models to replicate experiments and sophisticated mathematical models. Progress has been rapid, and we have seen science at its best; an intimate discussion between theory and data. References Bîrzu, G., Matin, S., Hallatschek, O., and Korolev, K. S. (2019). Genetic drift in range expansions is very sensitive to density dependence in dispersal and growth. Ecology Letters, 22(11), 1817-1827. doi: https://doi.org/10.1111/ele.13364 | Shifts from pulled to pushed range expansions caused by reduction of landscape connectivity | Maxime Dahirel, Aline Bertin, Marjorie Haond, Aurélie Blin, Eric Lombaert, Vincent Calcagno, Simon Fellous, Ludovic Mailleret, Thibaut Malausa, Elodie Vercken | <p>Range expansions are key processes shaping the distribution of species; their ecological and evolutionary dynamics have become especially relevant today, as human influence reshapes ecosystems worldwide. Many attempts to explain and predict ran... | | Evolutionary Applications, Evolutionary Dynamics, Evolutionary Ecology, Experimental Evolution, Phylogeography & Biogeography | Ben Phillips | 2020-08-04 12:51:56 | ||
04 Nov 2020
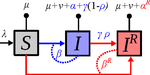
Treating symptomatic infections and the co-evolution of virulence and drug resistanceMore intense symptoms, more treatment, more drug-resistance: coevolution of virulence and drug-resistanceRecommended by Ludek Berec based on reviews by 3 anonymous reviewersMathematical models play an essential role in current evolutionary biology, and evolutionary epidemiology is not an exception [1]. While the issues of virulence evolution and drug-resistance evolution resonate in the literature for quite some time [2, 3], the study by Alizon [4] is one of a few that consider co-evolution of both these traits [5]. The idea behind this study is the following: treating individuals with more severe symptoms at a higher rate (which appears to be quite natural) leads to an appearance of virulent drug-resistant strains, via treatment failure. The author then shows that virulence in drug-resistant strains may face different selective pressures than in drug-sensitive strains and hence proceed at different rates. Hence, treatment itself modulates evolution of virulence. As one of the reviewers emphasizes, the present manuscript offers a mathematical view on why the resistant and more virulent strains can be selected in epidemics. Also, we both find important that the author highlights that the topic and results of this study can be attributed to public health policies and development of optimal treatment protocols [6]. References [1] Gandon S, Day T, Metcalf JE, Grenfell BT (2016) Forecasting epidemiological and evolutionary dynamics of infectious diseases. Trends Ecol Evol 31: 776-788. doi: https://doi.org/10.1016/j.tree.2016.07.010 | Treating symptomatic infections and the co-evolution of virulence and drug resistance | Samuel Alizon | <p>Antimicrobial therapeutic treatments are by definition applied after the onset of symptoms, which tend to correlate with infection severity. Using mathematical epidemiology models, I explore how this link affects the coevolutionary dynamics bet... | | Evolutionary Applications, Evolutionary Dynamics, Evolutionary Epidemiology, Evolutionary Theory | Ludek Berec | 2020-03-04 10:18:39 | ||
26 Aug 2021
Impact of ploidy and pathogen life cycle on resistance durabilityDurability of plant resistance to diploid pathogenRecommended by Hirohisa Kishino based on reviews by Loup Rimbaud and 1 anonymous reviewerDurability of plant resistance to diploid pathogen Hirohisa Kishino Based on the population genetic and epidemiologic model, Saubin et al. (2021) report that the resistant hosts generated by the breeding based on the gene-for-gene interaction is durable much longer against diploid pathogens than haploid pathogens. The avr allele of pathogen that confers the resistance is genetically recessive. The heterozygotes are not recognized by the resistant hosts and only the avr/avr homozygote is adaptive. As a result, the trajectory of avr allele frequency becomes more stochastic due to genetic drift. Although the paper focuses on the evolution of standing polymorphism, it seems obvious that the adaptive mutations in pathogen have much larger probability of being deleted from the population because the individuals own the avr allele mostly in the form of heterozygote at the initial phase after the mutation. Since only few among many models of plant resistance deployment study the case of diploid pathogen and the contribution of the pathogen life cycle, this work will add an important intellect to the literature (Rimbaud et al. 2021). From the study of host-parasite interaction in flax rust Melampsora lini, Flor (1942, 1955) showed that the host resistance is formed by the interaction of a host resistance gene and a corresponding pathogen gene. This gene-for-gene hypothesis has been supported by experimental evidence and has served as a basis of the methods of molecular breeding targeting the dominant R genes. However, modern agriculture provides the pathogen populations with the homogeneous environments and laid strong selection pressure on them. As a result, the newly developed resistant plants face the risk of immediate resistance breakdown (Möller and Stukenbrock 2017). Currently, quantitative resistance is getting attention as characters as a potential target for long-life (mild) resistant breeds (Lannou, 2012). They are polygenic and controlled partly by the same genes that mediate qualitative resistance but mostly by the genes that encode defense-related outputs such as strengthening of the cell wall or defense compound biosynthesis (Corwin and Kliebenstein, 2017). Progress of molecular genetics may overcome the technical difficulty (Bakkeren and Szabo, 2020). Saubin et al. (2021) notes that the pattern of genetic inheritance of the pathogen counterparts that respond to the host traits is crucial regarding with the durability of the resistant hosts. The resistance traits for which avr alleles are predicted to be recessive may be the targets of breeding. References Bakkeren, G., and Szabo, L. J. (2020) Progress on molecular genetics and manipulation of rust fungi. Phytopathology, 110, 532-543. https://doi.org/10.1094/PHYTO-07-19-0228-IA Corwin, J. A., and Kliebenstein, D. J. (2017) Quantitative resistance: more than just perception of a pathogen. The Plant Cell, 29, 655-665. https://doi.org/10.1105/tpc.16.00915 Flor, H. H. (1942) Inheritance of pathogenicity in a cross between physiological races 22 and 24 of Melampsova lini. Phytopathology, 35. Abstract. Flor, H. H. (1955) Host-parasite interactions in flax rust-its genetics and other implications. Phytopathology, 45, 680-685. Lannou, C. (2012) Variation and selection of quantitative traits in plant pathogens. Annual review of phytopathology, 50, 319-338. https://doi.org/10.1146/annurev-phyto-081211-173031 Möller, M. and Stukenbrock, E. H. (2017) Evolution and genome architecture in fungal plant pathogens. Nature Reviews Microbiology. 15, 756–771. https://doi.org/10.1038/nrmicro.2017.76 Rimbaud, L., Fabre, F., Papaïx, J., Moury, B., Lannou, C., Barrett, L. G., and Thrall, P. H. (2021) Models of Plant Resistance Deployment. Annual Review of Phytopathology, 59. https://doi.org/10.1146/annurev-phyto-020620-122134 Saubin, M., De Mita, S., Zhu, X., Sudret, B. and Halkett, F. (2021) Impact of ploidy and pathogen life cycle on resistance durability. bioRxiv, 2021.05.28.446112, ver. 4 peer-reviewed and recommended by Peer Community in Evolutionary Biology. https://doi.org/10.1101/2021.05.28.446112 | Impact of ploidy and pathogen life cycle on resistance durability | Méline Saubin, Stephane De Mita, Xujia Zhu, Bruno Sudret, Fabien Halkett | <p>The breeding of resistant hosts based on the gene-for-gene interaction is crucial to address epidemics of plant pathogens in agroecosystems. Resistant host deployment strategies are developed and studied worldwide to decrease the probability of... | | Evolutionary Applications, Evolutionary Epidemiology | Hirohisa Kishino | 2021-06-03 07:58:16 | ||
07 Jul 2017
Negative frequency-dependent selection is frequently confoundingUnmasking the delusive appearance of negative frequency-dependent selectionRecommended by Ignacio Bravo based on reviews by David Baltrus and 2 anonymous reviewersExplaining the processes that maintain polymorphisms in a population has been a fundamental line of research in evolutionary biology. One of the main mechanisms identified that preserves genetic diversity is negative frequency-dependent selection (NFDS), which constitutes a powerful framework for interpreting the presence of persistent polymorphisms. Nevertheless, a number of patterns that are often explained by invoking NFDS may also be compatible with, and possibly more easily explained by, different processes. References [1] Brisson D. 2017. Negative frequency-dependent selection is frequently confounding. bioRxiv 113324, ver. 3 of 20th June 2017. doi: 10.1101/113324 [2] Heino M, Metz JAJ and Kaitala V. 1998. The enigma of frequency-dependent selection. Trends in Ecology & Evolution 13: 367-370. doi: 1016/S0169-5347(98)01380-9 | Negative frequency-dependent selection is frequently confounding | Dustin Brisson | The existence of persistent genetic variation within natural populations presents an evolutionary problem as natural selection and genetic drift tend to erode genetic diversity. Models of balancing selection were developed to account for the high ... | | Evolutionary Applications, Evolutionary Theory, Population Genetics / Genomics | Ignacio Bravo | 2017-03-03 18:46:42 |


