
Latest recommendations

| Id | Title▲ | Authors | Abstract | Picture | Thematic fields | Recommender | Reviewers | Submission date | |
|---|---|---|---|---|---|---|---|---|---|
12 Nov 2021

How ancient forest fragmentation and riparian connectivity generate high levels of genetic diversity in a micro-endemic Malagasy treeAn ancient age of open-canopy landscapes in northern Madagascar? Evidence from the population genetic structure of a forest treeRecommended by Miguel de Navascués based on reviews by Katharina Budde and Yurena Arjona based on reviews by Katharina Budde and Yurena Arjona
We currently live in the Anthropocene, the geological age characterized by a profound impact of human populations in the ecosystems and the environment. While there is little doubt about the action of humans in the shaping of present landscapes, it can be difficult to determine what the state of those landscapes was before humans started to modify them. This is the case of the Madagascar grasslands, whose origins have been debated with arguments proposing them either as anthropogenic, created with the arrival of humans around 2000BP, or as ancient features of the natural landscape with a forest fragmentation process due to environmental changes pre-dating human arrival [e.g. 1,2]. One way to clarify this question is through the genetic study of native species. Population continuity and fragmentation along time shape the structure of the genetic diversity in space. Species living in a uniform continuous habitat are expected to show genetic structuring determined only by geographical distance. Recent changes of the habitat can take many generations to reshape that genetic structure [3]. Thus, we expect genetic structure to reflect ancient features of the landscape. The work by Jordi Salmona and collaborators [4] studies the factors determining the population genetic structure of the Malagasy spiny olive (Noronhia spinifolia). This narrow endemic species is distributed in the discontinuous forest patches of the Loky-Manambato region (northern Madagascar). Jordi Salmona and collaborators genotyped 72 individuals distributed across the species distribution with restriction associated DNA sequencing and organelle microsatellite markers. Then, they studied the population genetic structure of the species. Using isolation-by-resistance models [5], they tested the influence of several landscape features (forest cover, roads, rivers, slope, etc.) on the connectivity between populations. Maternally inherited loci (chloroplast and mitochondria) and bi-parentally inherited loci (nuclear), were analysed separately in an attempt to identify the role of pollen and seed dispersal in the connectivity of populations. Despite the small distribution of the species, Jordi Salmona and collaborators [4] found remarkable levels of genetic diversity. The spatial structure of this diversity was found to be mainly explained by the forest cover of the landscape, suggesting that the landscape has been composed by patches of forests and grasslands for a long time. The main role of forest cover for the connectivity among populations also highlights the importance of riparian forest as dispersal corridors. Finally, differences between organelle and nuclear markers were not enough to establish any strong conclusion about the differences between pollen and seed dispersal. The results presented by Jordi Salmona and collaborators [4] contribute to the understanding of the history and ecology of understudied Madagascar ecosystems. Previous population genetic studies in some forest-dwelling mammals have been interpreted as supporting an old age for the fragmented landscapes in northern Madagascar [e.g. 1,6]. To my knowledge, this is the first study on a tree species. While this work might not completely settle the debate, it emphasizes the importance of studying a diversity of species to understand the biogeographic dynamics of a region. References 1. Quéméré, E., X. Amelot, J. Pierson, B. Crouau-Roy, L. Chikhi (2012) Genetic data suggest a natural prehuman origin of open habitats in northern Madagascar and question the deforestation narrative in this region. Proceedings of the National Academy of Sciences of the United States of | How ancient forest fragmentation and riparian connectivity generate high levels of genetic diversity in a micro-endemic Malagasy tree | Jordi Salmona, Axel Dresen, Anicet E. Ranaivoson, Sophie Manzi, Barbara Le Pors, Cynthia Hong-Wa, Jacqueline Razanatsoa, Nicole V. Andriaholinirina, Solofonirina Rasoloharijaona, Marie-Elodie Vavitsara, Guillaume Besnard | <p>Understanding landscape changes is central to predicting evolutionary trajectories and defining conservation practices. While human-driven deforestation is intense throughout Madagascar, exception in areas like the Loky-Manambato region (North)... | | Evolutionary Ecology, Phylogeography & Biogeography, Population Genetics / Genomics | Miguel de Navascués | 2020-11-27 09:07:21 | ||
20 Dec 2022
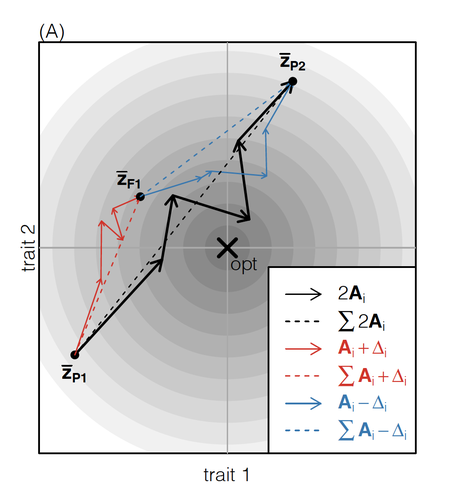
How does the mode of evolutionary divergence affect reproductive isolation?A general model of fitness effects following hybridisationRecommended by Matthew Hartfield based on reviews by Luis-Miguel Chevin and Juan LiStudying the effects of speciation, hybridisation, and evolutionary outcomes following reproduction from divergent populations is a major research area in evolutionary genetics [1]. There are two phenomena that have been the focus of contemporary research. First, a classic concept is the formation of ‘Bateson-Dobzhansky-Muller’ incompatibilities (BDMi) [2–4] that negatively affect hybrid fitness. Here, two diverging populations accumulate mutations over time that are unique to that subpopulation. If they subsequently meet, then these mutations might negatively interact, leading to a loss in fitness or even a complete lack of reproduction. BDMi formation can be complex, involving multiple genes and the fitness changes can depend on the direction of introgression [5]. Second, such secondary contact can instead lead to heterosis, where offspring are fitter than their parental progenitors [6]. Understanding which outcomes are likely to arise require one to know the potential fitness effects of mutations underlying reproductive isolation, to determine whether they are likely to reduce or enhance fitness when hybrids are formed. This is far from an easy task, as it requires one to track mutations at several loci, along with their effects, across a fitness landscape. The work of De Sanctis et al. [7] neatly fills in this knowledge gap, by creating a general mathematical framework for describing the consequences of a cross from two divergent populations. The derivations are based on Fisher’s Geometric Model, which is widely used to quantify selection acting on a general fitness landscape that is affected by several biological traits [8,9], and has previously been used in theoretical studies of hybridisation [10–12]. By doing so, they are able to decompose how divergence at multiple loci affects offspring fitness through both additive and dominance effects. A key result arising from their analyses is demonstrating how offspring fitness can be captured by two main functions. The first one is the ‘net effect of evolutionary change’ that, broadly defined, measures how phenotypically divergent two populations are. The second is the ‘total amount of evolutionary change’, which reflects how many mutations contribute to divergence and the effect sizes captured by each of them. The authors illustrate these measurements using simulations covering different scenarios, demonstrating how different parental states can lead to similar fitness outcomes. They also propose experimental methods to measure the underlying mutational effects. This study neatly demonstrates how complex genetic phenomena underlying hybridisation can be captured using fairly simple mathematical formulae. This powerful approach will thus open the door for future research to investigate hybridisation in more detail, whether it is by expanding on these theoretical models or using the elegant outcomes to quantify fitness effects in experiments.
References 1. Coyne JA, Orr HA. Speciation. Sunderland, Mass: Sinauer Associates; 2004. | How does the mode of evolutionary divergence affect reproductive isolation? | Bianca De Sanctis, Hilde Schneemann, John J. Welch | <p>When divergent populations interbreed, the outcome will be affected by the genomic and phenotypic differences that they have accumulated. In this way, the mode of evolutionary divergence between populations may have predictable consequences for... | | Adaptation, Evolutionary Theory, Hybridization / Introgression, Population Genetics / Genomics, Speciation | Matthew Hartfield | 2022-03-30 14:55:46 | ||
23 Apr 2020
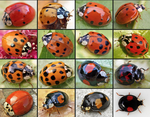
How do invasion syndromes evolve? An experimental evolution approach using the ladybird Harmonia axyridisSelection on a single trait does not recapitulate the evolution of life-history traits seen during an invasionRecommended by Inês Fragata and Ben Phillips based on reviews by 2 anonymous reviewersBiological invasions are natural experiments, and often show that evolution can affect dynamics in important ways [1-3]. While we often think of invasions as a conservation problem stemming from anthropogenic introductions [4,5], biological invasions are much more commonplace than this, including phenomena as diverse as natural range shifts, the spread of novel pathogens, and the growth of tumors. A major question across all these settings is which set of traits determine the ability of a population to invade new space [6,7]. Traits such as: increased growth or reproductive rate, dispersal ability and ability to defend from predation often show large evolutionary shifts across invasion history [1,6,8]. Are such multi-trait shifts driven by selection on multiple traits, or a correlated response by multiple traits to selection on one? Resolving this question is important for both theoretical and practical reasons [9,10]. But despite the importance of this issue, it is not easy to perform the necessary manipulative experiments [9]. References [1] Sakai, A.K., Allendorf, F.W., Holt, J.S. et al. (2001). The population biology of invasive species. Annual review of ecology and systematics, 32(1), 305-332. doi: 10.1146/annurev.ecolsys.32.081501.114037 | How do invasion syndromes evolve? An experimental evolution approach using the ladybird Harmonia axyridis | Julien Foucaud, Ruth A. Hufbauer, Virginie Ravigné, Laure Olazcuaga, Anne Loiseau, Aurelien Ausset, Su Wang, Lian-Sheng Zang, Nicolas Lemenager, Ashraf Tayeh, Arthur Weyna, Pauline Gneux, Elise Bonnet, Vincent Dreuilhe, Bastien Poutout, Arnaud Est... | <p>Experiments comparing native to introduced populations or distinct introduced populations to each other show that phenotypic evolution is common and often involves a suit of interacting phenotypic traits. We define such sets of traits that evol... | | Adaptation, Evolutionary Applications, Experimental Evolution, Life History, Quantitative Genetics | Inês Fragata | 2019-11-29 07:07:00 | ||
30 Jun 2023
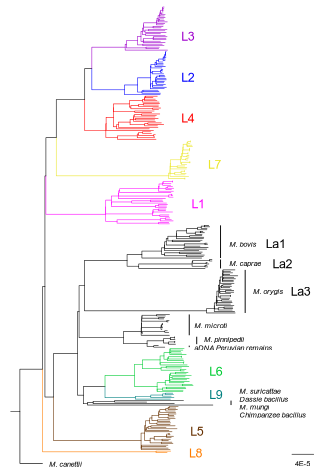
How do monomorphic bacteria evolve? The Mycobacterium tuberculosis complex and the awkward population genetics of extreme clonalityHow the tubercle bacillus got its genome: modernising, modelling, and making sense of the stories we tellRecommended by B. Jesse Shapiro based on reviews by 2 anonymous reviewersIn this instructive review, Stritt and Gagneux offer a balanced perspective on the evolutionary forces shaping Mycobacterium tuberculosis and make the case that our instinct for storytelling be balanced with quantitative models. M. tuberculosis is perhaps the best-known clonal bacterial pathogen – evolving largely in the absence of horizontal gene transfer. Its genome is full of puzzling patterns, including much higher GC content than most intracellular pathogens (which suggests efficient selection to resist AT-skewed mutational bias) but a very high ratio of nonsynonymous to synonymous substitution rates (dN/dS ~ 0.5, typically interpreted as weak selection against deleterious amino acid changes). The authors offer alternative explanations for these patterns, framing the question: is M. tuberculosis evolution shaped mainly by drift or by efficient selection? They propose that this question can only be answered by accounting for the pathogen’s extreme clonality. A clonal lifestyle can have its advantages, for example when adaptations must arise in a particular order (Kondrashov and Kondrashov 2001). An important disadvantage highlighted by the authors are linkage effects: without recombination to shuffle them up, beneficial mutations are linked to deleterious mutations in the same genome (hitchhiking) and purging deleterious mutations also purges neutral diversity across the genome (background selection). The authors propose the latter – efficient purifying selection and strong linkage – as an explanation for the low genetic diversity observed in M. tuberculosis. This is of course not exclusive of other related explanations, such as clonal interference (Gerrish and Lenski 1998). They also champion the use of forward evolutionary simulations (Haller and Messer 2019) to model the interplay between selection, recombination, and demography as a powerful alternative to traditional backward coalescent models. At times, Stritt and Gagneux are pessimistic about our existing methods – arguing that dN/dS and homoplasies “tell us little about the frequency and strength of selection.” Even though I favour a more optimistic view, I fully agree that our traditional population genetic metrics are sensitive to a slew of different deviations from a standard neutral evolution model and must be interpreted with caution. As I and others have argued, the extent of recombination (measured as the amount of linkage in a genome) is a key factor in determining how best to test for natural selection (Shapiro et al. 2009) and to conduct genotype-phenotype association studies (Chen and Shapiro 2021) in microbes. While this article is focused on the well-studied M. tuberculosis complex, there are many parallels with other clonal bacteria, including pathogens and symbionts. Whatever your favourite bug, we must all be careful to make sure the stories we tell about them are not “just so tales” but are supported, to the extent possible, by data and quantitative models. References Chen, Peter E., and B. Jesse Shapiro. 2021. "Classic Genome-Wide Association Methods Are Unlikely to Identify Causal Variants in Strongly Clonal Microbial Populations." bioRxiv. Stritt, C., Gagneux, S. (2023). How do monomorphic bacteria evolve? The Mycobacterium tuberculosis complex and the awkward population genetics of extreme clonality. EcoEvoRxiv, ver.3 peer-reviewed and recommended by Peer Community in Evolutionary Biology. https://doi.org/10.32942/X2GW2P | How do monomorphic bacteria evolve? The *Mycobacterium tuberculosis* complex and the awkward population genetics of extreme clonality | Christoph Stritt, Sebastien Gagneux | <p style="text-align: justify;">Exchange of genetic material through sexual reproduction or horizontal gene transfer is ubiquitous in nature. Among the few outliers that rarely recombine and mainly evolve by <em>de novo</em> mutation are a group o... | | Evolutionary Dynamics, Genome Evolution, Molecular Evolution, Population Genetics / Genomics, Reproduction and Sex | B. Jesse Shapiro | Gonçalo Themudo | 2022-12-16 13:41:53 | |
12 Feb 2024
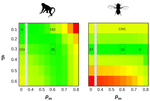
How do plant RNA viruses overcome the negative effect of Muller s ratchet despite strong transmission bottlenecks?How to survive the mutational meltdown: lessons from plant RNA virusesRecommended by Kavita Jain based on reviews by Brent Allman, Ana Morales-Arce and 1 anonymous reviewerAlthough most mutations are deleterious, the strongly deleterious ones do not spread in a very large population as their chance of fixation is very small. Another mechanism via which the deleterious mutations can be eliminated is via recombination or sexual reproduction. However, in a finite asexual population, the subpopulation without any deleterious mutation will eventually acquire a deleterious mutation resulting in the reduction of the population size or in other words, an increase in the genetic drift. This, in turn, will lead the population to acquire deleterious mutations at a faster rate eventually leading to a mutational meltdown. This irreversible (or, at least over some long time scales) accumulation of deleterious mutations is especially relevant to RNA viruses due to their high mutation rate, and while the prior work has dealt with bacteriophages and RNA viruses, the study by Lafforgue et al. [1] makes an interesting contribution to the existing literature by focusing on plants. In this study, the authors enquire how despite the repeated increase in the strength of genetic drift, how the RNA viruses manage to survive in plants. Following a series of experiments and some numerical simulations, the authors find that as expected, after severe bottlenecks, the fitness of the population decreases significantly. But if the bottlenecks are followed by population expansion, the Muller’s ratchet can be halted due to the genetic diversity generated during population growth. They hypothesize this mechanism as a potential way by which the RNA viruses can survive the mutational meltdown. As a theoretician, I find this investigation quite interesting and would like to see more studies addressing, e.g., the minimum population growth rate required to counter the potential extinction for a given bottleneck size and deleterious mutation rate. Of course, it would be interesting to see in future work if the hypothesis in this article can be tested in natural populations. References [1] Guillaume Lafforgue, Marie Lefebvre, Thierry Michon, Santiago F. Elena (2024) How do plant RNA viruses overcome the negative effect of Muller s ratchet despite strong transmission bottlenecks? bioRxiv, ver. 3 peer-reviewed and recommended by Peer Community In Evolutionary Biology | How do plant RNA viruses overcome the negative effect of Muller s ratchet despite strong transmission bottlenecks? | Guillaume Lafforgue, Marie Lefebvre, Thierry Michon, Santiago F. Elena | <p>Muller's ratchet refers to the irreversible accumulation of deleterious mutations in small populations, resulting in a decline in overall fitness. This phenomenon has been extensively observed in experiments involving microorganisms, including ... | | Experimental Evolution, Genome Evolution | Kavita Jain | 2023-08-04 09:37:08 | ||
29 Sep 2022
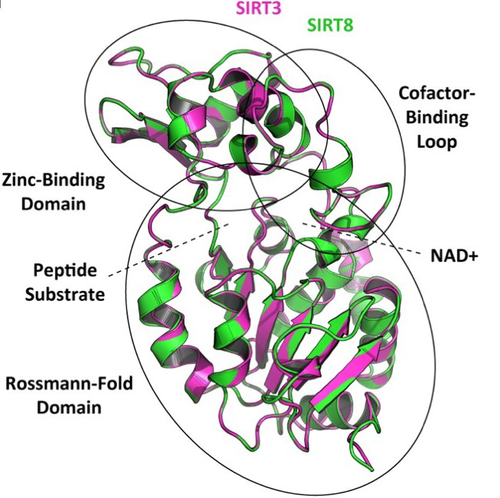
How many sirtuin genes are out there? evolution of sirtuin genes in vertebrates with a description of a new family memberMaking sense of vertebrate sirtuin genesRecommended by Frédéric Delsuc based on reviews by Filipe Castro, Nicolas Leurs and 1 anonymous reviewerSirtuin proteins are class III histone deacetylases that are involved in a variety of fundamental biological functions mostly related to aging. These proteins are located in different subcellular compartments and are associated with different biological functions such as metabolic regulation, stress response, and cell cycle control [1]. In mammals, the sirtuin gene family is composed of seven paralogs (SIRT1-7) grouped into four classes [2]. Due to their involvement in maintaining cell cycle integrity, sirtuins have been studied as a way to understand fundamental mechanisms governing longevity [1]. Indeed, the downregulation of sirtuin genes with aging seems to explain much of the pathophysiology that accumulates with aging [3]. Biomedical studies have thus explored the potential therapeutic implications of sirtuins [4] but whether they can effectively be used as molecular targets for the treatment of human diseases remains to be demonstrated [1]. Despite this biomedical interest and some phylogenetic analyses of sirtuin paralogs mostly conducted in mammals, a comprehensive evolutionary analysis of the sirtuin gene family at the scale of vertebrates was still lacking. In this preprint, Opazo and collaborators [5] took advantage of the increasing availability of whole-genome sequences for species representing all main groups of vertebrates to unravel the evolution of the sirtuin gene family. To do so, they undertook a phylogenomic approach in its original sense aimed at improving functional predictions by evolutionary analysis [6] in order to inventory the full vertebrate sirtuin gene repertoire and reconstruct its precise duplication history. Harvesting genomic databases, they extracted all predicted sirtuin proteins and performed phylogenetic analyses based on probabilistic inference methods. Maximum likelihood and Bayesian analyses resulted in well-resolved and congruent phylogenetic trees dividing vertebrate sirtuin genes into three major clades. These analyses also revealed an additional eighth paralog that was previously overlooked because of its restricted phyletic distribution. This newly identified sirtuin family member (named SIRT8) was recovered with unambiguous statistical support as a sister-group to the SIRT3 clade. Comparative genomic analyses based on conserved gene synteny confirmed that SIRT8 was present in all sampled non-amniote vertebrate genomes (cartilaginous fish, bony fish, coelacanth, lungfish, and amphibians) except cyclostomes. SIRT8 has thus most likely been lost in the last common ancestor of amniotes (mammals, reptiles, and birds). Discovery of such previously unknown genes in vertebrates is not completely surprising given the plethora of high-quality genomes now available. However, this study highlights the importance of considering a broad taxonomic sampling to infer evolutionary patterns of gene families that have been mostly studied in mammals because of their potential importance for human biology. Based on its phylogenetic position as closely related to SIRT3 within class I, it could be predicted that the newly identified SIRT8 paralog likely has a deacetylase activity and is probably located in mitochondria. To test these evolutionary predictions, Opazo and collaborators [5] conducted further bioinformatics analyses and functional experiments using the elephant shark (Callorhinchus milii) as a model species. RNAseq expression data were analyzed to determine tissue-specific transcription of sirtuin genes in vertebrates, including SIRT8 found to be mainly expressed in the ovary, which suggests a potential role in biological processes associated with reproduction. The elephant shark SIRT8 protein sequence was used with other vertebrates for comparative analyses of protein structure modeling and subcellular localization prediction both pointing to a probable mitochondrial localization. The protein localization and its function were further characterized by immunolocalization in transfected cells, and enzymatic and functional assays, which all confirmed the prediction that SIRT8 proteins are targeted to the mitochondria and have deacetylase activity. The extensive experimental efforts made in this study to shed light on the function of this newly discovered gene are both rare and highly commendable. Overall, this work by Opazo and collaborators [5] provides a comprehensive phylogenomic study of the sirtuin gene family in vertebrates based on detailed evolutionary analyses using state-of-the-art phylogenetic reconstruction methods. It also illustrates the power of adopting an integrative comparative approach supplementing the reconstruction of the duplication history of the gene family with complementary functional experiments in order to elucidate the function of the newly discovered SIRT8 family member. These results provide a reference phylogenetic framework for the evolution of sirtuin genes and the further functional characterization of the eight vertebrate paralogs with potential relevance for understanding the cellular biology of aging and its associated diseases in human. References [1] Vassilopoulos A, Fritz KS, Petersen DR, Gius D (2011) The human sirtuin family: Evolutionary divergences and functions. Human Genomics, 5, 485. https://doi.org/10.1186/1479-7364-5-5-485 [2] Yamamoto H, Schoonjans K, Auwerx J (2007) Sirtuin Functions in Health and Disease. Molecular Endocrinology, 21, 1745–1755. https://doi.org/10.1210/me.2007-0079 [3] Morris BJ (2013) Seven sirtuins for seven deadly diseases ofaging. Free Radical Biology and Medicine, 56, 133–171. https://doi.org/10.1016/j.freeradbiomed.2012.10.525 [4] Bordo D Structure and Evolution of Human Sirtuins. Current Drug Targets, 14, 662–665. http://dx.doi.org/10.2174/1389450111314060007 [5] Opazo JC, Vandewege MW, Hoffmann FG, Zavala K, Meléndez C, Luchsinger C, Cavieres VA, Vargas-Chacoff L, Morera FJ, Burgos PV, Tapia-Rojas C, Mardones GA (2022) How many sirtuin genes are out there? evolution of sirtuin genes in vertebrates with a description of a new family member. bioRxiv, 2020.07.17.209510, ver. 5 peer-reviewed and recommended by Peer Community in Evolutionary Biology. https://doi.org/10.1101/2020.07.17.209510 [6] Eisen JA (1998) Phylogenomics: Improving Functional Predictions for Uncharacterized Genes by Evolutionary Analysis. Genome Research, 8, 163–167. https://doi.org/10.1101/gr.8.3.163 | How many sirtuin genes are out there? evolution of sirtuin genes in vertebrates with a description of a new family member | Juan C. Opazo, Michael W. Vandewege, Federico G. Hoffmann, Kattina Zavala, Catalina Meléndez, Charlotte Luchsinger, Viviana A. Cavieres, Luis Vargas-Chacoff, Francisco J. Morera, Patricia V. Burgos, Cheril Tapia-Rojas, Gonzalo A. Mardones | <p style="text-align: justify;">Studying the evolutionary history of gene families is a challenging and exciting task with a wide range of implications. In addition to exploring fundamental questions about the origin and evolution of genes, disent... | | Molecular Evolution | Frédéric Delsuc | Filipe Castro, Anonymous, Nicolas Leurs | 2022-05-12 16:06:04 | |
20 May 2020
How much does Ne vary among species?Further questions on the meaning of effective population sizeRecommended by Martin Lascoux based on reviews by 3 anonymous reviewersIn spite of its name, the effective population size, Ne, has a complex and often distant relationship to census population size, as we usually understand it. In truth, it is primarily an abstract concept aimed at measuring the amount of genetic drift occurring in a population at any given time. The standard way to model random genetic drift in population genetics is the Wright-Fisher model and, with a few exceptions, definitions of the effective population size stems from it: “a certain model has effective population size, Ne, if some characteristic of the model has the same value as the corresponding characteristic for the simple Wright-Fisher model whose actual size is Ne” (Ewens 2004). Since Sewall Wright introduced the concept of effective population size in 1931 (Wright 1931), it has flourished and there are today numerous definitions of it depending on the process being examined (genetic diversity, loss of alleles, efficacy of selection) and the characteristic of the model that is considered. These different definitions of the effective population size were generally introduced to address specific aspects of the evolutionary process. One aspect that has been hotly debated since the first estimates of genetic diversity in natural populations were published is the so-called Lewontin’s paradox (1974). Lewontin noted that the observed variation in heterozygosity across species was much smaller than one would expect from the neutral expectations calculated with the actual size of the species. References Brandvain Y, Wright SI (2016) The Limits of Natural Selection in a Nonequilibrium World. Trends in Genetics, 32, 201–210. doi: 10.1016/j.tig.2016.01.004 | How much does Ne vary among species? | Nicolas Galtier, Marjolaine Rousselle | <p>Genetic drift is an important evolutionary force of strength inversely proportional to *Ne*, the effective population size. The impact of drift on genome diversity and evolution is known to vary among species, but quantifying this effect is a d... | | Bioinformatics & Computational Biology, Genome Evolution, Molecular Evolution, Population Genetics / Genomics | Martin Lascoux | 2019-12-08 00:11:00 | ||
06 Apr 2021
How robust are cross-population signatures of polygenic adaptation in humans?Be careful when studying selection based on polygenic score overdispersionRecommended by Torsten Günther based on reviews by Lawrence Uricchio, Mashaal Sohail, Barbara Bitarello and 1 anonymous reviewer
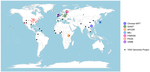
The advent of genome-wide association studies (GWAS) has been a great promise for our understanding of the connection between genotype and phenotype. Today, the NHGRI-EBI GWAS catalog contains 251,401 associations from 4,961 studies (1). This wealth of studies has also generated interest to use the summary statistics beyond the few top hits in order to make predictions for individuals without known phenotype, e.g. to predict polygenic risk scores or to study polygenic selection by comparing different groups. For instance, polygenic selection acting on the most studied polygenic trait, height, has been subject to multiple studies during the past decade (e.g. 2–6). They detected north-south gradients in Europe which were consistent with expectations. However, their GWAS summary statistics were based on the GIANT consortium data set, a meta-analysis of GWAS conducted in different European cohorts (7,8). The availability of large data sets with less stratification such as the UK Biobank (9) has led to a re-evaluation of those results. The nature of the GIANT consortium data set was realized to represent a potential problem for studies of polygenic adaptation which led several of the authors of the original articles to caution against the interpretations of polygenic selection on height (10,11). This was a great example on how the scientific community assessed their own earlier results in a critical way as more data became available. At the same time it left the question whether there is detectable polygenic selection separating populations more open than ever. Generally, recent years have seen several articles critically assessing the portability of GWAS results and risk score predictions to other populations (12–14). Refoyo-Martínez et al. (15) are now presenting a systematic assessment on the robustness of cross-population signatures of polygenic adaptation in humans. They compiled GWAS results for complex traits which have been studied in more than one cohort and then use allele frequencies from the 1000 Genomes Project data (16) set to detect signals of polygenic score overdispersion. As the source for the allele frequencies is kept the same across all tests, differences between the signals must be caused by the underlying GWAS. The results are concerning as the level of overdispersion largely depends on the choice of GWAS cohort. Cohorts with homogenous ancestries show little to no overdispersion compared to cohorts of mixed ancestries such as meta-analyses. It appears that the meta-analyses fail to fully account for stratification in their data sets. The authors based most of their analyses on the heavily studied trait height. Additionally, they use educational attainment (measured as the number of school years of an individual) as an example. This choice was due to the potential over- or misinterpretation of results by the media, the general public and by far right hate groups. Such traits are potentially confounded by unaccounted cultural and socio-economic factors. Showing that previous results about polygenic selection on educational attainment are not robust is an important result that needs to be communicated well. This forms a great example for everyone working in human genomics. We need to be aware that our results can sometimes be misinterpreted. And we need to make an effort to write our papers and communicate our results in a way that is honest about the limitations of our research and that prevents the misuse of our results by hate groups. This article represents an important contribution to the field. It is cruicial to be aware of potential methodological biases and technical artifacts. Future studies of polygenic adaptation need to be cautious with their interpretations of polygenic score overdispersion. A recommendation would be to use GWAS results obtained in homogenous cohorts. But even if different biobank-scale cohorts of homogeneous ancestry are employed, there will always be some remaining risk of unaccounted stratification. These conclusions may seem sobering but they are part of the scientific process. We need additional controls and new, different methods than polygenic score overdispersion for assessing polygenic selection. Last year also saw the presentation of a novel approach using sequence data and GWAS summary statistics to detect directional selection on a polygenic trait (17). This new method appears to be robust to bias stemming from stratification in the GWAS cohort as well as other confounding factors. Such new developments show light at the end of the tunnel for the use of GWAS summary statistics in the study of polygenic adaptation. References 1. Buniello A, MacArthur JAL, Cerezo M, Harris LW, Hayhurst J, Malangone C, et al. The NHGRI-EBI GWAS Catalog of published genome-wide association studies, targeted arrays and summary statistics 2019. Nucleic Acids Research. 2019 Jan 8;47(D1):D1005–12. doi: https://doi.org/10.1093/nar/gky1120 2. Turchin MC, Chiang CW, Palmer CD, Sankararaman S, Reich D, Hirschhorn JN. Evidence of widespread selection on standing variation in Europe at height-associated SNPs. Nature Genetics. 2012 Sep;44(9):1015–9. doi: https://doi.org/10.1038/ng.2368 3. Berg JJ, Coop G. A Population Genetic Signal of Polygenic Adaptation. PLOS Genetics. 2014 Aug 7;10(8):e1004412. doi: https://doi.org/10.1371/journal.pgen.1004412 4. Robinson MR, Hemani G, Medina-Gomez C, Mezzavilla M, Esko T, Shakhbazov K, et al. Population genetic differentiation of height and body mass index across Europe. Nature Genetics. 2015 Nov;47(11):1357–62. doi: https://doi.org/10.1038/ng.3401 5. Mathieson I, Lazaridis I, Rohland N, Mallick S, Patterson N, Roodenberg SA, et al. Genome-wide patterns of selection in 230 ancient Eurasians. Nature. 2015 Dec;528(7583):499–503. doi: https://doi.org/10.1038/nature16152 6. Racimo F, Berg JJ, Pickrell JK. Detecting polygenic adaptation in admixture graphs. Genetics. 2018. Arp;208(4):1565–1584. doi: https://doi.org/10.1534/genetics.117.300489 7. Lango Allen H, Estrada K, Lettre G, Berndt SI, Weedon MN, Rivadeneira F, et al. Hundreds of variants clustered in genomic loci and biological pathways affect human height. Nature. 2010 Oct;467(7317):832–8. doi: https://doi.org/10.1038/nature09410 8. Wood AR, Esko T, Yang J, Vedantam S, Pers TH, Gustafsson S, et al. Defining the role of common variation in the genomic and biological architecture of adult human height. Nat Genet. 2014 Nov;46(11):1173–86. doi: https://doi.org/10.1038/ng.3097 9. Bycroft C, Freeman C, Petkova D, Band G, Elliott LT, Sharp K, et al. The UK Biobank resource with deep phenotyping and genomic data. Nature. 2018 Oct;562(7726):203–9. doi: https://doi.org/10.1038/s41586-018-0579-z 10. Berg JJ, Harpak A, Sinnott-Armstrong N, Joergensen AM, Mostafavi H, Field Y, et al. Reduced signal for polygenic adaptation of height in UK Biobank. eLife. 2019 Mar 21;8:e39725. doi: https://doi.org/10.7554/eLife.39725 11. Sohail M, Maier RM, Ganna A, Bloemendal A, Martin AR, Turchin MC, et al. Polygenic adaptation on height is overestimated due to uncorrected stratification in genome-wide association studies. eLife. 2019 Mar 21;8:e39702. doi: https://doi.org/10.7554/eLife.39702 12. Martin AR, Kanai M, Kamatani Y, Okada Y, Neale BM, Daly MJ. Clinical use of current polygenic risk scores may exacerbate health disparities. Nature Genetics. 2019 Apr;51(4):584–91. doi: https://doi.org/10.1038/s41588-019-0379-x 13. Bitarello BD, Mathieson I. Polygenic Scores for Height in Admixed Populations. G3: Genes, Genomes, Genetics. 2020 Nov 1;10(11):4027–36. doi: https://doi.org/10.1534/g3.120.401658 14. Uricchio LH, Kitano HC, Gusev A, Zaitlen NA. An evolutionary compass for detecting signals of polygenic selection and mutational bias. Evolution Letters. 2019;3(1):69–79. doi: https://doi.org/10.1002/evl3.97 15. Refoyo-Martínez A, Liu S, Jørgensen AM, Jin X, Albrechtsen A, Martin AR, Racimo F. How robust are cross-population signatures of polygenic adaptation in humans? bioRxiv, 2021, 2020.07.13.200030, version 5 peer-reviewed and recommended by Peer community in Evolutionary Biology. doi: https://doi.org/10.1101/2020.07.13.200030 16. Auton A, Abecasis GR, Altshuler DM, Durbin RM, Abecasis GR, Bentley DR, et al. A global reference for human genetic variation. Nature. 2015 Sep 30;526(7571):68–74. doi: https://doi.org/10.1038/nature15393 17. Stern AJ, Speidel L, Zaitlen NA, Nielsen R. Disentangling selection on genetically correlated polygenic traits using whole-genome genealogies. bioRxiv. 2020 May 8;2020.05.07.083402. doi: https://doi.org/10.1101/2020.05.07.083402 | How robust are cross-population signatures of polygenic adaptation in humans? | Alba Refoyo-Martínez, Siyang Liu, Anja Moltke Jørgensen, Xin Jin, Anders Albrechtsen, Alicia R. Martin, Fernando Racimo | <p>Over the past decade, summary statistics from genome-wide association studies (GWASs) have been used to detect and quantify polygenic adaptation in humans. Several studies have reported signatures of natural selection at sets of SNPs associated... | | Bioinformatics & Computational Biology, Genetic conflicts, Human Evolution, Population Genetics / Genomics | Torsten Günther | 2020-08-14 15:06:54 | ||
31 Mar 2017
POSTPRINT
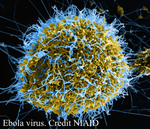
Human adaptation of Ebola virus during the West African outbreakEbola evolution during the 2013-2016 outbreakRecommended by Sylvain Gandon and Sébastien LionThe Ebola virus (EBOV) epidemic that started in December 2013 resulted in around 28,000 cases and more than 11,000 deaths. Since the emergence of the disease in Zaire in 1976 the virus had produced a number of outbreaks in Africa but until 2013 the reported numbers of human cases had never risen above 500. Could this exceptional epidemic size be due to the spread of a human-adapted form of the virus? The large mutation rate of the virus [1-2] may indeed introduce massive amounts of genetic variation upon which selection may act. Several earlier studies based on the accumulation of genome sequences sampled during the epidemic led to contrasting conclusions. A few studies discussed evidence of positive selection on the glycoprotein that may be linked to phenotypic variations on infectivity and/or immune evasion [3-4]. But the heterogeneity in the transmission of some lineages could also be due to environmental heterogeneity and/or stochasticity. Most studies could not rule out the null hypothesis of the absence of positive selection and human adaptation [1-2 and 5]. In a recent experimental study, Urbanowicz et al. [6] chose a different method to tackle this question. A phylogenetic analysis of genome sequences from viruses sampled in West Africa revealed the existence of two main lineages (one with a narrow geographic distribution in Guinea, and the other with a wider geographic distribution) distinguished by a single amino acid substitution in the glycoprotein of the virus (A82V), and of several sub-lineages characterised by additional substitutions. The authors used this phylogenetic data to generate a panel of mutant pseudoviruses and to test their ability to infect human and fruit bat cells. These experiments revealed that specific amino acid substitutions led to higher infectivity of human cells, including A82V. This increased infectivity on human cells was associated with a decreased infectivity in fruit bat cell cultures. Since fruit bats are likely to be the reservoir of the virus, this paper indicates that human adaptation may have led to a specialization of the virus to a new host. An accompanying paper in the same issue of Cell by Diehl et al. [7] reports results that confirm the trend identified by Urbanowicz et al. [6] and further indicate that the increased infectivity of A82V is specific for primate cells. Diehl et al. [7] also report some evidence for higher virulence of A82V in humans. In other words, the evolution of the virus may have led to higher abilities to infect and to kill its novel host. This work thus confirms the adaptive potential of RNA virus and the ability of Ebola to specialize to a novel host. In this context, the availability of an effective vaccine against the disease is particularly welcome [8]. The study of Urbanowicz et al. [6] is also remarkable because it illustrates the need of experimental approaches for the study of phenotypic variation when inference methods based on phylodynamics fail to extract a clear biological message. The analysis of genomic evolution is still in its infancy and there is a need for new theoretical developments to help detect more rapidly candidate mutations involved in adaptations to new environmental conditions. References [1] Gire, S.K., Goba, A., Andersen, K.G., Sealfon, R.S.G., Park, D.J., Kanneh, L., Jalloh, S., Momoh, M., Fullah, M., Dudas, G., et al. (2014). Genomic surveillance elucidates Ebola virus origin and transmission during the 2014 outbreak. Science 345, 1369–1372. doi: 10.1126/science.1259657 | Human adaptation of Ebola virus during the West African outbreak | Urbanowicz, R.A., McClure, C.P., Sakuntabhai, A., Sall, A.A., Kobinger, G., Müller, M.A., Holmes, E.C., Rey, F.A., Simon-Loriere, E., and Ball, J.K. | The 2013–2016 outbreak of Ebola virus (EBOV) in West Africa was the largest recorded. It began following the cross-species transmission of EBOV from an animal reservoir, most likely bats, into humans, with phylogenetic analysis revealing the co-ci... | | Adaptation, Evolutionary Epidemiology, Genome Evolution, Genotype-Phenotype, Molecular Evolution, Species interactions | Sylvain Gandon | 2017-03-31 14:20:38 | ||
31 Jan 2018
Identifying drivers of parallel evolution: A regression model approachA new statistical tool to identify the determinant of parallel evolutionRecommended by Stephanie Bedhomme based on reviews by Bastien Boussau and 1 anonymous reviewerIn experimental evolution followed by whole genome resequencing, parallel evolution, defined as the increase in frequency of identical changes in independent populations adapting to the same environment, is often considered as the product of similar selection pressures and the parallel changes are interpreted as adaptive. References [1] Bailey SF, Guo Q and Bataillon T (2018) Identifying drivers of parallel evolution: A regression model approach. bioRxiv 118695, ver. 4 peer-reviewed by Peer Community In Evolutionary Biology. doi: 10.1101/118695 [2] Lang GI, Rice DP, Hickman, MJ, Sodergren E, Weinstock GM, Botstein D, and Desai MM (2013) Pervasive genetic hitchhiking and clonal interference in forty evolving yeast populations. Nature 500: 571–574. doi: 10.1038/nature12344 | Identifying drivers of parallel evolution: A regression model approach | Susan F Bailey, Qianyun Guo, Thomas Bataillon | <p>This preprint has been reviewed and recommended by Peer Community In Evolutionary Biology (http://dx.doi.org/10.24072/pci.evolbiol.100045). Parallel evolution, defined as identical changes arising in independent populations, is often attributed... | | Experimental Evolution, Molecular Evolution | Stephanie Bedhomme | 2017-03-22 14:54:48 |
 , where Ne is the effective population size and
  is the mean fitness effect of non-synonymous mutations. Assuming further that distinct species share a common DFE and therefore a common
  . Applying their newly developed approach to various datasets they conclude that the power of drift varies by a factor of at least 500 between large-Ne (Drosophila) and small-Ne species (H. sapiens). This is an order of magnitude larger than what would be obtained by comparing estimates of the variation in neutral diversity. Hence the proposed approach seems to have gone some way in making Lewontin’s paradox less paradoxical. But, perhaps more importantly, as the authors tersely point out at the end of the abstract their results further questions the meaning of Ne parameters in population genetics. And arguably this could well be the most important contribution of their study and something that is badly needed.


